
Audience: Senior/Advanced engineers building production-grade operators managing O(10³–10⁵) Custom Resources.
Table of Contents
- Scope & Assumptions
- The Reconciliation Mental Model
- A Throughput Model for Capacity Planning
- The API Server Is Your Real Bottleneck
- Reconcile Loop Performance & Latency
- Rate Limiting & Queue Depth
- Work Queue Backpressure Strategies
- Write Amplification
- Finalizers at Scale
- Cache & Informer Efficiency
- Leader Election & Operator Sharding
- Observability & SLOs
- Load & Failure Testing
- Common Anti-Patterns
- Putting It All Together: A Scaling Checklist
- Closing Thoughts
Scope & Assumptions
Before diving in, it’s worth being explicit about what this document covers — and what it doesn’t.
In scope:
- Kubernetes ≥ 1.26
- controller-runtime ≥ v0.17 (Go 1.21+)
- Single cluster control plane
- Operators managing O(10³–10⁵) CRs
- API server is a shared, rate-limited dependency — not dedicated to your operator
Non-goals:
- CRD design best practices
- Admission webhooks
- Multi-cluster federation
- Operator SDK specifics (patterns apply, APIs differ)
Violating the “shared API server” assumption changes almost every tuning recommendation in this post. If you have a dedicated API server, you can be more aggressive. In most real environments, you don’t.
The Reconciliation Mental Model
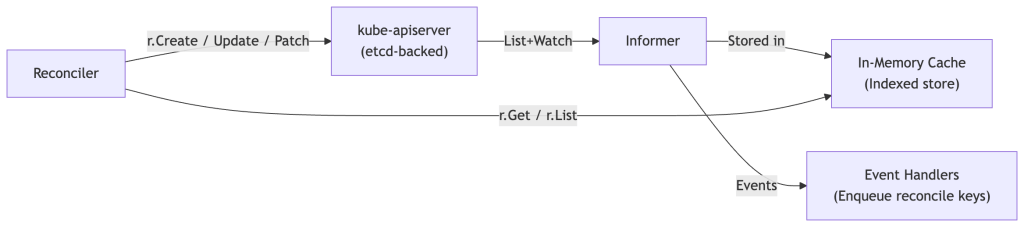
Most operator engineers understand the basic loop: watch for changes, reconcile desired vs. actual state, repeat. What becomes non-obvious at scale is that the reconciler isn’t a single pipeline — it is a concurrent, rate-limited, queue-backed distributed system in miniature, and every design decision compounds when you go from 50 to 50,000 Custom Resources (CRs).
Before diving into individual dimensions, establish the full lifecycle of a reconciliation event:
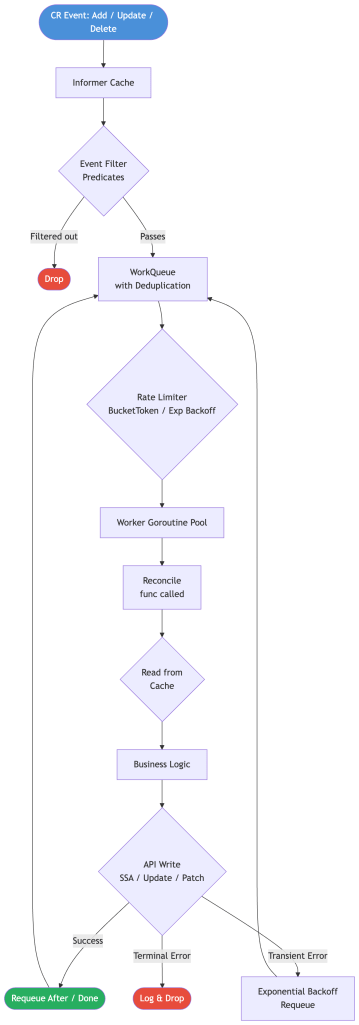
Every box in this diagram is a knob you can tune. The rest of this post unpacks each one.
A Throughput Model for Capacity Planning
Before touching any configuration, build a mental model of your system’s throughput ceiling. This gives you a principled basis for tuning rather than cargo-culting numbers from blog posts.
Steady-State Throughput
Your operator’s throughput has three independent ceilings. The one with the lowest value wins — raising any other ceiling above it gives you nothing until you raise that one first.
Ceiling 1 — Workers
Workers are your goroutines running Reconcile(). Each worker can only process one reconcile at a time, so:
worker_throughput = MaxConcurrentReconciles / avg_reconcile_duration
Think of it like a checkout line: if you have 50 cashiers and each transaction takes 200ms, you can serve 250 customers/sec.
50 workers ÷ 0.2s per reconcile = 250 reconciles/sec
Ceiling 2 — Rate Limiter
The work queue’s token bucket caps how many reconciles per second are dispatched, regardless of how many workers are free. If your rate limiter is set to 100 QPS, your workers will sit idle even when the queue is full.
Ceiling 3 — API Server Write Capacity
Your operator shares the API server with the whole cluster. Even if your workers and rate limiter are healthy, the API server can reject or throttle writes. This is gated by your APF PriorityLevelConfiguration and etcd write throughput.
Effective throughput is the minimum of all three:
effective_throughput = min( worker_throughput, # MaxConcurrentReconciles / avg_duration rate_limiter_QPS, # your token bucket cap api_server_write_capacity # from APF config + etcd)
Practical implication: If your rate limiter is 100 QPS and you have 200 workers, you have 100 idle workers. Adding more workers won’t help — raise the rate limiter (and verify your API server budget can absorb it).
Drain Time Under Burst
When a thundering herd hits — rolling node restart, mass deployment, operator pod bounce — every CR may enqueue at once. Use this to estimate how long your system takes to recover:
drain_time = queued_CRs / effective_throughput
Worked example — two scenarios with 10,000 CRs enqueued:
Scenario A: 50 workers, 250ms avg reconcile, rate limiter at 500 QPS
worker_throughput = 50 / 0.25s = 200 rec/seceffective_throughput = min(200, 500) = 200 rec/sec ← workers are the bottleneckdrain_time = 10,000 / 200 = 50 seconds
Scenario B: Same workers, but rate limiter capped at 100 QPS
worker_throughput = 200 rec/sec (unchanged)effective_throughput = min(200, 100) = 100 rec/sec ← rate limiter is now the bottleneckdrain_time = 10,000 / 100 = 100 seconds
The only change between scenarios is the rate limiter — nothing else. Drain time doubled. This is the most common “why isn’t adding workers helping?” situation.
The rate limiter is often the binding constraint, not worker count. Blindly increasing MaxConcurrentReconciles without tuning the rate limiter and cfg.QPS produces no improvement.
Capacity Planning Reference
Use this table to size your operator given a target drain time of ≤ 30 seconds under full burst. “Workers Needed” and “API Server QPS Needed” are the minimum for each respective bottleneck — you need both to hold, not just one.
| CR Count | Avg Reconcile Duration | Workers Needed | API Server QPS Needed |
|---|---|---|---|
| 1,000 | 100ms | 4 | 34 |
| 10,000 | 100ms | 34 | 334 |
| 10,000 | 500ms | 167 | 334 |
| 50,000 | 200ms | 334 | 1,667 |
How to read this: At 10,000 CRs with 500ms reconciles, you need 167 workers and 334 QPS of API server budget. If you only have 50 workers, your actual drain time is 10,000 / min(100, 334) = 100 seconds — bounded by workers. If you have 167 workers but only 100 QPS of API server budget, your drain time is 10,000 / min(334, 100) = 100 seconds — now bounded by the API server. Both ceilings must be high enough.
At the bottom of this table you’re well past what a single operator instance should attempt. That’s where sharding enters.
The API Server Is Your Real Bottleneck
This is the most commonly overlooked constraint in operator scaling.
Default client-go Limits Are Tiny
The default rest.Config QPS settings are designed for human-paced tooling, not operators:
// client-go defaults — almost certainly wrong for a production operatorcfg.QPS = 5 // 5 requests/seccfg.Burst = 10 // burst up to 10
An operator with 50 workers will be throttled to a crawl by these defaults. You won’t see obvious 429 errors — you’ll see mysteriously slow reconciles as the HTTP client self-throttles before requests even leave the pod. Always override them:
cfg, err := ctrl.GetConfig()cfg.QPS = 100 // tune to your API server capacity and APF priority levelcfg.Burst = 200mgr, err := ctrl.NewManager(cfg, ctrl.Options{ ... })
The right value depends on your API server’s total load, the APF priority level assigned to your operator’s ServiceAccount, and how many other controllers compete for capacity.
API Priority & Fairness (APF)
Kubernetes 1.20+ replaced the old --max-requests-inflight with API Priority and Fairness. Your operator’s requests are classified into a FlowSchema and queued in a PriorityLevelConfiguration. Without explicit configuration, your operator likely lands in global-default — a shared bucket that gets exhausted under any meaningful cluster load.
APF works through two cooperating objects:
PriorityLevelConfiguration— defines a bucket of API server concurrency slots and how they’re managedFlowSchema— defines which requests (from which subjects, targeting which resources) get routed into that bucket
Think of a PriorityLevelConfiguration as a dedicated lane on a highway, and a FlowSchema as the on-ramp rules for who is allowed into it.
For high-throughput operators, create a dedicated priority level:
apiVersion: flowcontrol.apiserver.k8s.io/v1kind: PriorityLevelConfigurationmetadata: name: my-operator-highspec: # "Limited" means this level competes for a share of the API server's # total concurrency. The alternative is "Exempt" — used by system-critical # components like kube-controller-manager — which bypasses all limits entirely. # Never use Exempt for your own operator. type: Limited limited: # nominalConcurrencyShares is not a hard slot count — it's a weight. # The API server distributes its total concurrency budget proportionally # across all Limited priority levels based on these weights. # # Example: If the API server allows 600 total concurrent requests and # you have three Limited levels with shares of 30, 30, and 40, they get # 180, 180, and 240 slots respectively. # # The built-in "global-default" level has 20 shares. Setting yours to 30 # gives your operator ~1.5× the concurrency of the default bucket. # Tune this based on your operator's share of total cluster API load. nominalConcurrencyShares: 30 limitResponse: # "Queue" means requests that exceed current concurrency are held in a # queue and dispatched when a slot opens. The alternative is "Reject", # which returns 429 immediately when slots are full — only appropriate # for truly latency-sensitive paths where queuing delay is worse than failure. type: Queue queuing: # The number of FIFO sub-queues within this priority level. # APF uses shuffle sharding: each incoming request is assigned to a # small random subset of queues (controlled by handSize) and placed # in the shortest one. More queues = better isolation between flows, # but higher memory overhead. 16 is a reasonable default. queues: 16 # handSize controls how many queues each request "tries" when being # placed. A request is assigned to the shortest queue among its # handSize candidates. Higher handSize = better load balancing # across queues, but increases the probability that two competing # flows share a queue (reducing isolation). # # The trade-off: low handSize (e.g., 1) gives perfect isolation but # poor load balancing; high handSize (e.g., queues-1) gives perfect # balancing but no isolation. 4 is the standard default. handSize: 4 # Maximum number of requests allowed to wait in any single sub-queue. # Once a sub-queue hits this limit, new requests for that flow are # rejected with 429 rather than queued further. # # Total buffer capacity = queues × queueLengthLimit = 16 × 50 = 800 # pending requests. Size this based on your burst profile and # acceptable tail latency — a longer queue absorbs more burst but # increases worst-case wait time. queueLengthLimit: 50apiVersion: flowcontrol.apiserver.k8s.io/v1kind: FlowSchemametadata: name: my-operatorspec: # Which PriorityLevelConfiguration this schema routes matched requests into. priorityLevelConfiguration: name: my-operator-high # Lower number = higher precedence. APF evaluates all FlowSchemas in # ascending precedence order and routes each request to the first match. # Built-in schemas use 0–999. The "global-default" catch-all uses 10000. # 500 is a safe value that sits below system-critical flows (< 200) but # above the default catch-all — ensures your operator's requests match # here before falling through to global-default. matchingPrecedence: 500 rules: - subjects: # Match requests originating from your operator's ServiceAccount. # This is the most precise subject — locks routing to your operator's # identity specifically, not to any other workload in the namespace. - kind: ServiceAccount serviceAccount: name: my-operator namespace: my-operator-ns resourceRules: # Which API requests from the above subjects this schema captures. # Tighten this to the actual resources your operator touches in production. # Overly broad rules (["*"] on everything) can inadvertently capture # read traffic (List, Watch) that you might prefer to route differently. - verbs: ["*"] apiGroups: ["mygroup.example.com"] resources: ["*"]
Verifying APF is working
After applying, confirm your operator’s requests are landing in the right priority level:
# Watch APF metrics — look for your priority level namekubectl get --raw /metrics | grep apiserver_flowcontrol | grep my-operator-high# Key metrics to check:# apiserver_flowcontrol_current_inqueue_requests — requests waiting in queue# apiserver_flowcontrol_current_executing_requests — requests actively being served# apiserver_flowcontrol_rejected_requests_total — requests dropped (429'd)# apiserver_flowcontrol_request_wait_duration_seconds — time spent in queue
If current_inqueue_requests is consistently non-zero, your concurrency share is too small — increase nominalConcurrencyShares. If rejected_requests_total is climbing, your queue depth (queues × queueLengthLimit) is being exhausted under burst — increase queueLengthLimit or nominalConcurrencyShares.
Common misconfiguration: routing reads and writes together
Your operator issues two categories of API requests with very different throughput profiles:
- Reads (Get, List, Watch) — high volume, cache-backed, cheap on etcd
- Writes (Create, Update, Patch, Delete) — lower volume, always hit etcd, expensive
A single PriorityLevelConfiguration for both means a flood of List/Watch requests can exhaust queue slots and delay your writes. For operators managing O(10k+) CRs, consider splitting into two schemas — one for reads with a broad queueLengthLimit, one for writes with a higher nominalConcurrencyShares:
# Write-path priority level — higher concurrency share, tighter queue# (writes are fewer but more critical to reconcile throughput)nominalConcurrencyShares: 30queuing: queues: 16 queueLengthLimit: 30 # fail fast if write slots are exhausted# Read-path priority level — lower concurrency share, larger queue buffer# (reads are more tolerant of queuing delay)nominalConcurrencyShares: 10queuing: queues: 16 queueLengthLimit: 100 # absorb read bursts without dropping
etcd Write Amplification
Every API write translates to an etcd write. etcd’s performance is bounded by disk fsync latency — typically 1–10ms on SSDs. At high write rates, etcd becomes the bottleneck long before your operator or API server saturates CPU.
Signs of etcd pressure:
etcd_disk_backend_commit_duration_secondsP99 climbing- API server latency increasing without an obvious load spike on the operator side
429responses despite low operator QPS
Mitigations: minimize writes per reconcile (see Write Amplification), prefer Server-Side Apply to reduce conflict retries, and batch status updates.
Reconcile Loop Performance & Latency
Measure First
Instrument your reconcile duration as a histogram before optimizing anything:
var reconcileDuration = prometheus.NewHistogramVec( prometheus.HistogramOpts{ Name: "operator_reconcile_duration_seconds", Help: "Duration of reconcile loop iterations", // Buckets starting at 1ms, doubling 15 times: 1ms → 2ms → 4ms → ... → 16s. // This range covers both fast cache-hit reconciles (sub-10ms) and // slow outliers with external calls or retries (multi-second). // Adjust the upper bound if your reconciles regularly exceed 16s. Buckets: prometheus.ExponentialBuckets(0.001, 2, 15), }, // "controller" lets you reuse this metric across multiple controllers // in the same operator binary. "result" splits success vs. error so // you can compute error rate directly from this histogram without a // separate counter. []string{"controller", "result"},)func (r *MyReconciler) Reconcile(ctx context.Context, req ctrl.Request) (ctrl.Result, error) { // Capture the wall-clock start time before any work begins — including // the cache read in r.reconcile. This measures total Reconcile() cost, // not just business logic. start := time.Now() result, err := r.reconcile(ctx, req) // Separate success and error observations so you can alert on error rate // and compare latency distributions between healthy and failing reconciles. // A rising P99 on the "error" label often indicates retry storms or slow // external dependencies, while a rising P99 on "success" points to logic cost. resultLabel := "success" if err != nil { resultLabel = "error" } reconcileDuration.WithLabelValues("mycontroller", resultLabel). Observe(time.Since(start).Seconds()) return result, err}
Target: P99 reconcile duration should fit within your drain-time budget from the throughput model. If your P99 is 10× your P50, you have outlier reconciles worth investigating — they disproportionately consume worker slots and inflate your effective throughput calculation.
Common Latency Culprits
1. Unconditional API reads
The controller-runtime Client is cache-backed by default — r.Client.Get and r.Client.List read from the local informer cache, not the API server. The exception is r.APIReader, which bypasses the cache and hits the API server directly. Use APIReader only when you need a strongly consistent read and are willing to pay the latency and QPS cost.
Be aware of cache staleness: the cache reflects the last List+Watch state. Under normal operation, staleness is bounded by network RTT plus informer processing time — typically milliseconds, not the resync period. Resync is a correctness backstop, not a freshness mechanism.
Correctness invariant: Reads from the cache are eventually consistent. Design reconcile logic to tolerate stale reads — never assume a read reflects the latest write you just made in the same reconcile pass. If you write an object and immediately read it back, you may see the pre-write state. This is a common source of subtle off-by-one reconcile cycles.
2. Sequential writes when parallel is possible
// ❌ Sequential — each write blocks the nextfor _, child := range children { if err := r.Create(ctx, child); err != nil { return ctrl.Result{}, err }}
Replace with bounded concurrency using errgroup:
// ✅ Bounded parallel writesg, gctx := errgroup.WithContext(ctx)sem := make(chan struct{}, 10) // max 10 concurrent API calls per reconcilefor _, child := range children { child := child g.Go(func() error { sem <- struct{}{} defer func() { <-sem }() return r.Create(gctx, child) })}if err := g.Wait(); err != nil { return ctrl.Result{}, err}
Note: parallelism within a reconcile amplifies API server pressure — bound the semaphore relative to your global QPS budget, not just local convenience.
3. Expensive status computation
If computing .Status requires listing many child objects, structure your owned-object watches so status can be derived from events rather than re-enumerated on every reconcile. Computing aggregated status by listing 100 child Pods on every reconcile, at 50 reconciles/sec, is 5,000 list operations per second — expensive in CPU and allocations even against the local cache.
4. Unnecessary requeues
ctrl.Result{RequeueAfter: 30 * time.Second} on a healthy, stable object is self-inflicted load. At 10,000 CRs with a 30-second requeue, that’s ~333 reconciles/sec of purely unnecessary work — consuming a large fraction of your effective QPS budget to accomplish nothing.
if myObj.Status.Phase == PhasePending { return ctrl.Result{RequeueAfter: 10 * time.Second}, nil}// Stable — let watches drive the next reconcilereturn ctrl.Result{}, nil
Rate Limiting & Queue Depth
How controller-runtime Rate Limiting Works
controller-runtime uses a workqueue.RateLimiter on the internal work queue. By default it uses BucketRateLimiter combined with ItemExponentialFailureRateLimiter, composed via MaxOf:
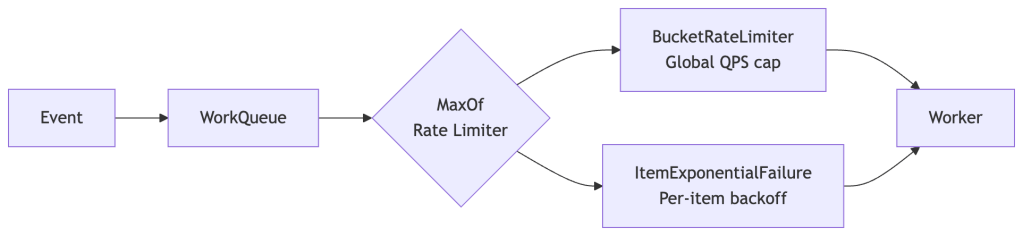
An item waits for whichever limiter imposes the longer delay. A high global QPS cap doesn’t help an item in exponential backoff from repeated errors. A low global cap throttles everything regardless of per-item error state. Size each independently.
Customizing the Rate Limiter
The default global QPS cap is 10 — correct for a kubebuilder tutorial, wrong for a production operator:
ctrl.NewControllerManagedBy(mgr). For(&myv1.MyResource{}). WithOptions(controller.Options{ MaxConcurrentReconciles: 50, RateLimiter: workqueue.NewMaxOfRateLimiter( // Per-item exponential backoff: 5ms base, 500s max // (default 1000s max is often too long — tune to your recovery SLO) workqueue.NewItemExponentialFailureRateLimiter( 5*time.Millisecond, 500*time.Second, ), // Global token bucket: ~cfg.QPS / avg_writes_per_reconcile &workqueue.BucketRateLimiter{ Limiter: rate.NewLimiter(rate.Limit(100), 200), }, ), }). Complete(r)
Sizing guidance: Set rate.Limit to approximately cfg.QPS / avg_writes_per_reconcile. If each reconcile issues 5 API writes on average and cfg.QPS = 500, the rate limiter ceiling should be around 100 reconciles/sec.
Rate Limiting Topology: One Queue vs. Many
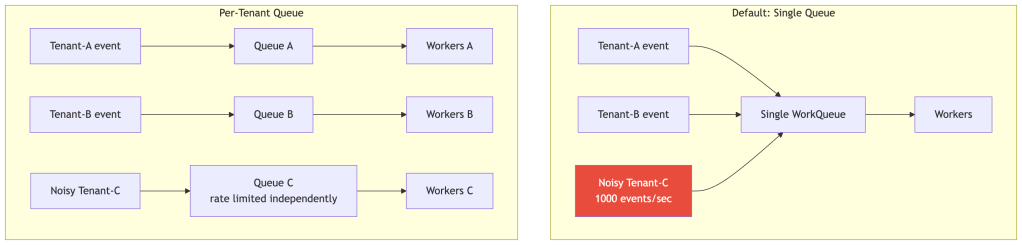
A single global queue means one noisy tenant can starve all others. At multi-tenant platform scale, per-tenant or per-namespace queues with independent rate limiters give you isolation. This requires stepping outside controller-runtime’s default queue management — significant complexity, but necessary at the upper end of scale.
Queue Depth as a Signal
| Queue Depth Behavior | Diagnosis |
|---|---|
| Spikes during deploys, drains quickly | Normal — burst absorbed correctly |
| Consistently high, drains slowly | Workers undersized or rate limiter too tight |
| Slowly growing without bound | Queue leak — unconditional requeues |
| Flat at zero | Under-watched or predicates too aggressive |
// controller-runtime exposes workqueue_depth automatically.// For custom queues, instrument explicitly:prometheus.MustRegister(prometheus.NewGaugeFunc( prometheus.GaugeOpts{ Name: "operator_queue_depth", Help: "Current depth of the reconcile work queue", }, func() float64 { return float64(r.Queue.Len()) },))
Work Queue Backpressure Strategies
The Fundamental Invariant
Reconcile must be idempotent and level-triggered.
If this invariant is violated, no scaling technique — rate limiting, sharding, caching — will save you. They will merely obscure the correctness problem until load reveals it.
This is not a style preference — it is a correctness requirement that the entire controller model depends on.
Why Level-Triggered Matters at Scale
The work queue deduplicates by key: if CR foo/bar is enqueued 50 times while a worker is busy, only one reconcile fires when the worker is free. Intermediate states are invisible.
Failure mode of edge-triggered reconcile:
Event 1: CR spec.replicas = 3 → reconcile enqueuedEvent 2: CR spec.replicas = 5 → deduplicated (same key, not yet processed)Worker picks up the key → reconcile sees spec.replicas = 5If reconciler acted on "what changed" from Event 1, it reconciles toward 3.→ Permanent drift
// ❌ Edge-triggered — broken at scalefunc (r *Reconciler) Reconcile(ctx context.Context, req ctrl.Request) (ctrl.Result, error) { if lastEvent.Type == EventTypeDelete { return r.handleDelete(ctx, req) } // ...}// ✅ Level-triggered — always correctfunc (r *Reconciler) Reconcile(ctx context.Context, req ctrl.Request) (ctrl.Result, error) { var obj myv1.MyResource if err := r.Get(ctx, req.NamespacedName, &obj); err != nil { if apierrors.IsNotFound(err) { return ctrl.Result{}, nil // Object gone — nothing to do } return ctrl.Result{}, err } // Always reconcile toward obj's current spec, not any specific event return r.reconcileCurrentState(ctx, &obj)}
The Thundering Herd
A cluster upgrade rolling 500 nodes simultaneously produces 5,000+ reconcile events. Without backpressure:
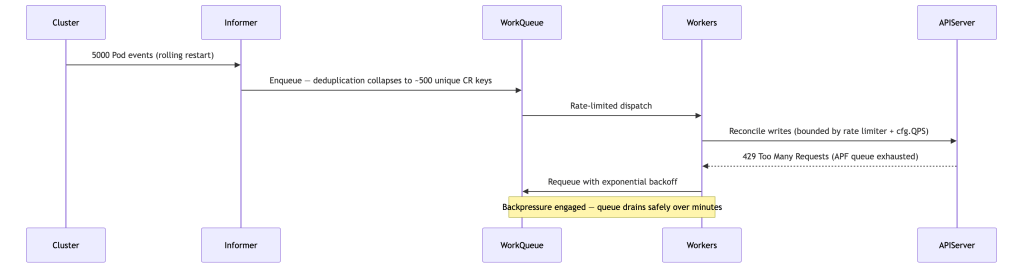
Key insight: deduplication is what makes this survivable. Without it, 5,000 events become 5,000 reconciles in flight simultaneously.
Backoff Tuning for Transient Errors
| Error Type | Strategy |
|---|---|
API server 429 | Fixed delay, do not count toward per-item failure backoff |
| Dependency not ready | Moderate fixed backoff + watch-driven requeue when dependency changes |
| Network timeout | Return err — let ItemExponentialFailureRateLimiter handle backoff |
| Validation/terminal error | Set status condition, return nil — no requeue |
func (r *Reconciler) reconcileCurrentState(ctx context.Context, obj *myv1.MyResource) (ctrl.Result, error) { dep, err := r.ensureDependency(ctx, obj) if err != nil { if apierrors.IsTooManyRequests(err) { // Honor API server backpressure — fixed delay, not counted as item failure return ctrl.Result{RequeueAfter: 5 * time.Second}, nil } if isTerminalError(err) { r.setFailedStatus(ctx, obj, err) return ctrl.Result{}, nil // No requeue } // Transient — return err, let ItemExponentialFailureRateLimiter back off return ctrl.Result{}, err } _ = dep return ctrl.Result{}, nil}
Note on
Retry-After:apierrors.IsTooManyRequestsdetects429status, but the actualRetry-Afterresponse header is not surfaced by client-go’s error types — parsing it requires intercepting the raw HTTP response. A conservative fixed delay (5–10s) is a practical approximation for most operators.
Generation & ResourceVersion Gating
Use .metadata.generation to skip reconciles triggered by status-only updates (which increment resourceVersion but not generation):
func (r *Reconciler) SetupWithManager(mgr ctrl.Manager) error { return ctrl.NewControllerManagedBy(mgr). For(&myv1.MyResource{}, builder.WithPredicates( predicate.GenerationChangedPredicate{}, )). Complete(r)}
Caution:
GenerationChangedPredicateapplies only to the primary watched type. Owned child objects don’t have a meaningfulgenerationin the same sense — useResourceVersionChangedPredicatefor those, or write custom predicates that filter on semantically meaningful field changes.
Write Amplification
Write amplification is one of the most insidious scaling killers in production operators, and it’s rarely discussed explicitly.
The Amplification Chain
A single CR spec change cascades into many API writes:

At scale: 1 CR change → 10–50 API writes is not unusual. At 100 reconciles/sec, that’s 1,000–5,000 API writes/sec — enough to saturate etcd on standard hardware.
Mitigations
1. Use Server-Side Apply (SSA)
SSA lets the API server merge fields rather than requiring a full object replace, eliminating resourceVersion conflict retries:
obj := &appsv1.Deployment{ TypeMeta: metav1.TypeMeta{ APIVersion: "apps/v1", Kind: "Deployment", }, ObjectMeta: metav1.ObjectMeta{ Name: "my-deployment", Namespace: req.Namespace, }, Spec: desiredSpec,}if err := r.Patch(ctx, obj, client.Apply, client.FieldOwner("my-operator"), client.ForceOwnership,); err != nil { return ctrl.Result{}, err}
2. Avoid no-op updates
Before writing, check if the current state already matches desired. This is especially important for status updates, which trigger watch events and may cascade into additional reconciles:
if !equality.Semantic.DeepEqual(obj.Status, desiredStatus) { obj.Status = desiredStatus if err := r.Status().Update(ctx, obj); err != nil { return ctrl.Result{}, err }}
3. Batch status updates
If your reconcile has multiple stages that each want to update status, defer all status writes to the end of the reconcile. One status write per reconcile, not one per stage.
4. Minimize status churn
Avoid high-cardinality or frequently-changing data in status fields — sub-second timestamps, counters that increment on every reconcile. Every status change triggers a resourceVersion bump → watch event → potential reconcile enqueue. This is a feedback loop that generates load proportional to CR count × reconcile frequency.
Finalizers at Scale
Finalizers are one of the most underestimated scaling problems in operator design. They turn deletes into reconciles — which is exactly the right abstraction for cleanup, but carries significant throughput implications at scale.
How Finalizers Become a Throughput Problem
Without a finalizer, deleting a CR removes it immediately. With a finalizer, the API server marks it as DeletingTimestamp set, and your operator must complete cleanup before removing the finalizer — only then does the object disappear. This means:
Mass delete of 1,000 CRs→ 1,000 objects enter Terminating state simultaneously→ 1,000 reconciles enqueued (all triggered by DeletingTimestamp)→ Each reconcile does cleanup work (API calls, external system calls)→ Each successful cleanup writes a finalizer patch + triggers a watch event→ Cleanup throughput bounded by reconcile throughput
If cleanup is slow (external API calls, database writes, cascading child deletions), the Terminating backlog can grow faster than it drains — leaving hundreds of CRs stuck in Terminating indefinitely.
Failure Modes
- Slow cleanup blocking the queue: Finalizer cleanup that blocks on slow external systems holds worker slots, reducing effective reconcile throughput for all other CRs
- Non-idempotent cleanup: If cleanup is not safe to re-run, a partial cleanup followed by a reconcile loop requeue can cause double-delete or data corruption
- Permanent leaks: A bug in cleanup logic (unhandled error path that never removes the finalizer) leaves objects stuck in
Terminatingforever — they accumulate silently - External dependency unavailability: If your cleanup calls an external system that’s down during a mass delete, every CR in
Terminatingwill be stuck until the system recovers
Mitigations
1. Make cleanup idempotent and bounded in time
Cleanup must be safe to run multiple times and must not block indefinitely:
func (r *Reconciler) handleDeletion(ctx context.Context, obj *myv1.MyResource) (ctrl.Result, error) { if !controllerutil.ContainsFinalizer(obj, myFinalizer) { return ctrl.Result{}, nil // Already cleaned up } // Cleanup must be idempotent — safe to call multiple times if err := r.cleanupExternalResources(ctx, obj); err != nil { if isExternalSystemUnavailable(err) { // Don't block the queue — requeue with backoff return ctrl.Result{RequeueAfter: 30 * time.Second}, nil } return ctrl.Result{}, err } // Remove finalizer only after cleanup succeeds controllerutil.RemoveFinalizer(obj, myFinalizer) if err := r.Update(ctx, obj); err != nil { return ctrl.Result{}, err } return ctrl.Result{}, nil}
2. Use status conditions for long-running cleanup
If cleanup takes more than a few seconds, track progress in status rather than blocking the worker:
type MyResourceStatus struct { // ... CleanupPhase string `json:"cleanupPhase,omitempty"` // e.g., "DeletingChildren", "DeletingExternalResources", "Complete" CleanupProgress int `json:"cleanupProgress,omitempty"` // e.g., children deleted so far}
This gives operators visibility into cleanup state and allows partial progress to survive pod restarts.
3. Avoid blocking on external systems synchronously
If cleanup requires calling an external API that might be slow or unavailable, use an async pattern: issue the external call, record that it was issued in status, and requeue to verify completion:
if obj.Status.CleanupPhase == "" { // Phase 1: Issue async cleanup request if err := r.issueExternalCleanup(ctx, obj); err != nil { return ctrl.Result{}, err } obj.Status.CleanupPhase = "Pending" r.Status().Update(ctx, obj) return ctrl.Result{RequeueAfter: 10 * time.Second}, nil}if obj.Status.CleanupPhase == "Pending" { // Phase 2: Poll for completion done, err := r.checkExternalCleanupComplete(ctx, obj) if err != nil || !done { return ctrl.Result{RequeueAfter: 10 * time.Second}, nil } // Cleanup done — remove finalizer}
4. Monitor terminating object count
Terminating object count is a first-class operational metric. A growing Terminating count is a signal of a cleanup bottleneck or bug:
// Expose via a periodic background scanterminatingCount := prometheus.NewGauge(prometheus.GaugeOpts{ Name: "operator_terminating_objects_total", Help: "Number of CRs currently in Terminating state",})// In a background goroutine or periodic reconcile:var list myv1.MyResourceListr.List(ctx, &list)count := 0for _, obj := range list.Items { if !obj.DeletionTimestamp.IsZero() { count++ }}terminatingCount.Set(float64(count))
Alert when this value grows beyond a threshold that implies the cleanup queue cannot drain within your deletion SLO.
Cache & Informer Efficiency
How the Informer Cache Works
controller-runtime wraps client-go’s informer cache. Every object type your operator interacts with is listed and watched at startup, then maintained in an in-memory indexed store. Reads (r.Client.Get, r.Client.List) hit this store; writes go to the API server.
Cache Memory Footprint
At scale, cache memory becomes a hard constraint on operator pod sizing:
Approximate memory per cached object: 1–3 KB(depends on CRD size — large specs with many fields cost more)Example: 50k CRs + 200k child objects (Deployments, Services, ConfigMaps) = 250k objects × 2 KB avg = ~500 MB for the cache aloneAdd: controller-runtime overhead, goroutine stacks, Go runtime GC headroomRealistic total operator memory budget at this scale: 1–2 GB
Implications:
- Set pod memory limits accordingly — OOMKill during a thundering herd is a correctness failure, not just an availability event
- Avoid watching resource types you don’t need
- Prefer narrow watches (namespace-scoped, label-selected) over cluster-wide watches for high-cardinality resources like Pods or Events
Cache Scope: Cluster-wide vs. Namespaced
By default, the cache indexes all namespaces. Scope it when possible:
// Namespace-scoped cachemgr, err := ctrl.NewManager(cfg, ctrl.Options{ Cache: cache.Options{ DefaultNamespaces: map[string]cache.Config{ "team-a": {}, "team-b": {}, }, },})// Label-selector scoped cache for high-cardinality typesmgr, err := ctrl.NewManager(cfg, ctrl.Options{ Cache: cache.Options{ ByObject: map[client.Object]cache.ObjectCacheConfig{ &corev1.Pod{}: { Label: labels.SelectorFromSet(labels.Set{ "managed-by": "my-operator", }), }, }, },})
Selective Field Indexing
Without field indexes, r.List with arbitrary field filters scans the full cache in O(n). At 50k objects, that’s expensive in CPU and allocations on every reconcile:
// Register at startupconst clusterRefField = ".spec.clusterRef"if err := mgr.GetFieldIndexer().IndexField( context.Background(), &myv1.MyResource{}, clusterRefField, func(obj client.Object) []string { r := obj.(*myv1.MyResource) if r.Spec.ClusterRef == "" { return nil } return []string{r.Spec.ClusterRef} },); err != nil { return err}// O(1) lookup in reconcilevar relatedResources myv1.MyResourceListif err := r.List(ctx, &relatedResources, client.InNamespace(req.Namespace), client.MatchingFields{clusterRefField: clusterName},); err != nil { return ctrl.Result{}, err}
Watch Predicate Filtering
Every event on a watched resource type enqueues a reconcile. Without filtering, a highly active child resource (e.g., Pods with frequent annotation churn) generates enormous spurious load:
ctrl.NewControllerManagedBy(mgr). For(&myv1.MyResource{}). Owns(&corev1.Pod{}, builder.WithPredicates(predicate.Funcs{ UpdateFunc: func(e event.UpdateEvent) bool { oldPod := e.ObjectOld.(*corev1.Pod) newPod := e.ObjectNew.(*corev1.Pod) // Only trigger on phase transitions, not annotation/label churn return oldPod.Status.Phase != newPod.Status.Phase }, CreateFunc: func(e event.CreateEvent) bool { return true }, DeleteFunc: func(e event.DeleteEvent) bool { return true }, GenericFunc: func(e event.GenericEvent) bool { return false }, })). Complete(r)
Resync Period
The informer resync period triggers event handlers for all cached objects, which results in a full re-enqueue of reconcile keys — it’s a correctness safety net. The cache is kept fresh continuously via the Watch stream; resync is a belt-and-suspenders mechanism that fires reconciles for any object whose real state may have drifted from what the operator last acted on.
At 50,000 CRs with the default 10-minute resync, every 10 minutes you flood your queue with 50,000 reconcile enqueues — a self-inflicted thundering herd. Extend the period and compensate with explicit correctness mechanisms:
mgr, err := ctrl.NewManager(cfg, ctrl.Options{ Cache: cache.Options{ SyncPeriod: ptr.To(6 * time.Hour), },})
Correctness mechanisms to substitute for frequent resyncs:
- Generation-based status conditions with
lastTransitionTime - Observation timestamps in status, with alerting when they fall behind SLO
- Periodic controller-level health scans that target specific stale-detection patterns
Leader Election & Operator Sharding
Why Leader Election Isn’t Enough Alone
controller-runtime’s built-in leader election ensures only one replica actively reconciles — this gives you HA (fast failover) but not horizontal scale. A single leader is still bottlenecked to one process.
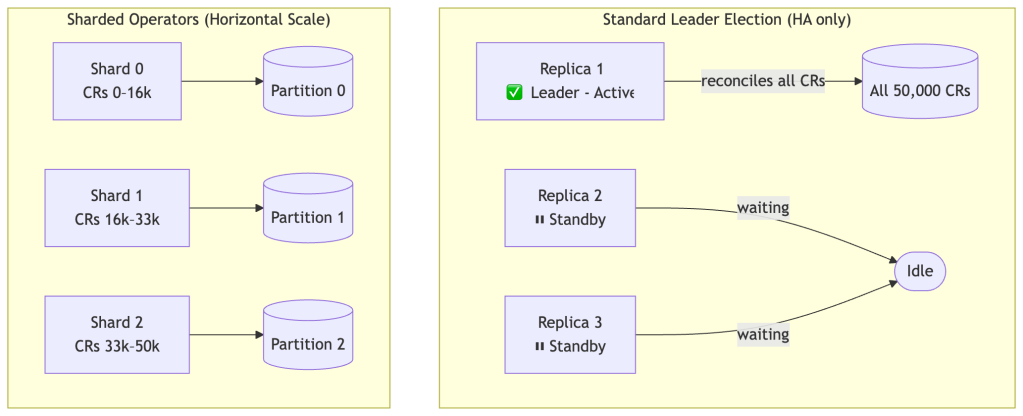
Sharding Strategies
Strategy 1: Label-based shard assignment
A shard-assignment controller (or webhook) stamps each CR with a shard label. Each operator shard watches only its assigned subset:
shardID := os.Getenv("SHARD_ID")ctrl.NewControllerManagedBy(mgr). For(&myv1.MyResource{}, builder.WithPredicates(predicate.Funcs{ CreateFunc: func(e event.CreateEvent) bool { return e.Object.GetLabels()["operator-shard"] == shardID }, UpdateFunc: func(e event.UpdateEvent) bool { return e.ObjectNew.GetLabels()["operator-shard"] == shardID }, DeleteFunc: func(e event.DeleteEvent) bool { return e.Object.GetLabels()["operator-shard"] == shardID }, GenericFunc: func(e event.GenericEvent) bool { return false }, })). Complete(r)
Strategy 2: Hash-based sharding (no label needed)
func belongsToShard(obj client.Object, shardID, totalShards int) bool { key := fmt.Sprintf("%s/%s", obj.GetNamespace(), obj.GetName()) h := fnv.New32a() h.Write([]byte(key)) return int(h.Sum32())%totalShards == shardID}UpdateFunc: func(e event.UpdateEvent) bool { return belongsToShard(e.ObjectNew, r.shardID, r.totalShards)},
Sharding Strategy Trade-offs
| Dimension | Label-based | Hash-based |
|---|---|---|
| Operational complexity | Higher (label management, assignment controller) | Lower |
| Stability on rescale | Stable (labels don’t change) | Rehash — assignments shift |
| Hot partition risk | Possible if labels are distributed unevenly | Low (hash distributes uniformly) |
| Split-brain risk during rescale | Low | Higher — transient dual ownership |
| Recommendation | Prefer if shard count changes frequently | Prefer for fixed or slow-changing shard count |
Sharding Failure Modes
- Split-brain: Multiple shards reconcile the same CR simultaneously. Happens during rescale windows with hash-based sharding, or if label propagation lags. Mandatory mitigation: idempotent reconcile.
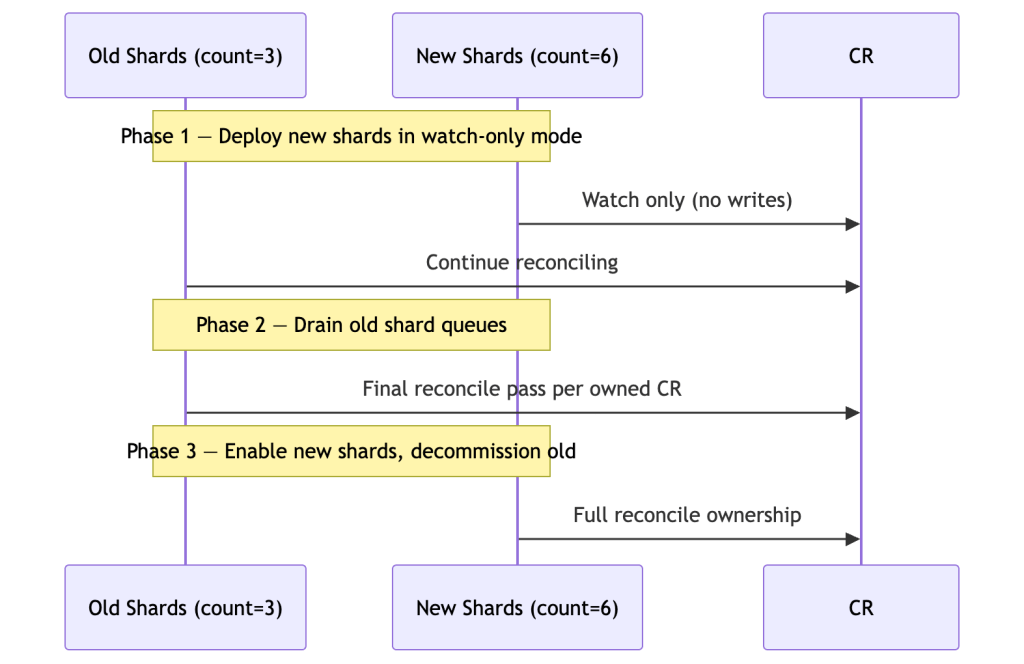
- Rehash storms: Increasing shard count causes a large fraction of CRs to be transiently owned by two shards. Use two-phase expansion.
- Hot partitions: If your CR namespace/name distribution is non-uniform, a hash-based shard can become overwhelmed. Monitor per-shard queue depth independently.
Two-Phase Shard Expansion
Shard Auto-scaling with HPA
apiVersion: autoscaling/v2kind: HorizontalPodAutoscalermetadata: name: my-operator-hpaspec: scaleTargetRef: apiVersion: apps/v1 kind: Deployment name: my-operator minReplicas: 3 maxReplicas: 20 metrics: - type: Pods pods: metric: name: operator_queue_depth_per_shard target: type: AverageValue averageValue: "500"
Warning: HPA-driven shard rescaling requires that your shard assignment logic handles count changes safely. Test rehash windows explicitly — a scale-out event during a thundering herd is the worst time to discover split-brain.
When Not to Shard
Sharding adds significant operational complexity. Before reaching for it, verify that the actual bottleneck is single-process saturation:
- API server QPS is the bottleneck, not CPU: Adding shards multiplies your write throughput but also multiplies your API server load. If etcd is already under pressure, more shards make it worse.
- Reconcile latency is high due to inefficient logic: Sharding distributes a slow reconcile across more pods — it doesn’t make each reconcile faster. Fix the logic first.
- Queue depth is low but lag is high: Low queue depth with high lag means workers are spending time doing expensive work per reconcile, not that there are too many items. More workers won’t help; faster reconciles will.
- You haven’t profiled
MaxConcurrentReconcilesheadroom: A single process with well-tuned concurrency and rate limiting can handle tens of thousands of CRs in many real workloads. Benchmark before sharding.
Sharding is the right tool when a single operator process is demonstrably CPU-saturated or API-server-QPS-saturated at maximum sensible worker count. Not before.
Observability & SLOs
Define the SLO First
Without an SLO, metrics are noise. Define what “working correctly” means before instrumenting:
Example SLO:"99% of CRs are reconciled to match their desired spec within 30 seconds of a spec change, measured over any 1-hour rolling window."
This single statement immediately implies:
- You need to measure reconcile lag (time from spec change to successful reconcile completion — not just reconcile duration)
- You need to track it at the 99th percentile, not the average
- You need error budget alerting when the burn rate is unsustainable
Measuring Reconcile Lag
Reconcile duration and reconcile lag are not the same thing.
- Reconcile duration: How long a single call to
Reconcile()takes - Reconcile lag: Time from
specchange to the completion of a successful reconcile for that generation
Lag is what your SLO should be based on. A fast reconcile function that runs infrequently produces low duration but high lag.
Implementation approach:
- Set
status.observedGenerationtometadata.generationon each successful reconcile - Record
status.lastReconciledTimeas the completion timestamp - Expose a metric:
time.Since(lastReconciledTime)for objects whereobservedGeneration < generation
// In your status typetype MyResourceStatus struct { ObservedGeneration int64 `json:"observedGeneration,omitempty"` LastReconciledTime metav1.Time `json:"lastReconciledTime,omitempty"` // ...}// At the end of a successful reconcileobj.Status.ObservedGeneration = obj.Generationobj.Status.LastReconciledTime = metav1.Now()if err := r.Status().Update(ctx, obj); err != nil { return ctrl.Result{}, err}
A scraper or a controller-level probe can then compute lag across all CRs:
// Computed metric: max lag across all CRs where observedGeneration < generationlagSeconds := time.Since(obj.Status.LastReconciledTime.Time).Seconds()if obj.Status.ObservedGeneration < obj.Generation { reconcileLag.WithLabelValues(obj.Name).Set(lagSeconds)}
This is the signal your SLO alert fires on — not reconcile_duration_seconds.
Derived Alerts from the SLO
| Alert | Threshold | Rationale |
|---|---|---|
queue_depth > 1000 for 5+ min | Tunable per shard | Queue not draining — SLO at risk |
reconcile_p99_duration > 20s | 2/3 of SLO budget | Latency headroom shrinking |
reconcile_error_rate > 5% for 10m | Burn rate | Error budget burning fast |
workqueue_longest_running_processor > 60s | Fixed | Stuck reconcile — goroutine leak candidate |
Key Metrics
| Metric | Type | Why It Matters |
|---|---|---|
reconcile_duration_seconds | Histogram | Primary throughput & latency signal |
reconcile_errors_total | Counter | Error rate by type |
workqueue_depth | Gauge | Backpressure health |
workqueue_longest_running_processor_seconds | Gauge | Stuck reconcile detection |
rest_client_requests_total | Counter | API server write amplification |
workqueue_retries_total | Counter | Requeue storm detection |
Wire up controller-runtime’s default metric server:
mgr, err := ctrl.NewManager(cfg, ctrl.Options{ Metrics: server.Options{ BindAddress: ":8080", },})
controller-runtime registers workqueue_* metrics automatically via client-go’s workqueue instrumentation. Verify they appear at /metrics before building dashboards around them.
Structured Per-Stage Reconcile Logging
For operators managing complex multi-step reconciles, stage-level breadcrumbs let you pinpoint which stage is slow or failing without requiring distributed tracing infrastructure:
func (r *Reconciler) reconcileCurrentState(ctx context.Context, obj *myv1.MyResource) (ctrl.Result, error) { log := log.FromContext(ctx).WithValues( "resource", obj.Name, "generation", obj.Generation, "resourceVersion", obj.ResourceVersion, ) stages := []struct { name string fn func() error }{ {"ensure-configmap", func() error { return r.ensureConfigMap(ctx, obj) }}, {"ensure-deployment", func() error { return r.ensureDeployment(ctx, obj) }}, {"sync-status", func() error { return r.syncStatus(ctx, obj) }}, } for _, stage := range stages { start := time.Now() if err := stage.fn(); err != nil { log.Error(err, "stage failed", "stage", stage.name, "elapsed", time.Since(start)) return ctrl.Result{}, err } log.V(1).Info("stage complete", "stage", stage.name, "elapsed", time.Since(start)) } return ctrl.Result{}, nil}
Load & Failure Testing
A scaling design is only as good as its tests. These scenarios are expected at staff level before a high-scale operator goes to production.
Test Matrix
| Scenario | What It Validates |
|---|---|
| Mass CR creation (10k objects in 60s) | Queue drain time, worker saturation, memory spike |
| Mass CR deletion | Finalizer cleanup throughput, Terminating backlog, orphan prevention |
| Finalizer cleanup with external system down | Cleanup backoff, non-blocking behavior, Terminating count stability |
| Node rolling restart (thundering herd) | Backpressure, deduplication, event-collapse correctness |
| API server throttling (inject synthetic 429s) | Backoff behavior, recovery time, queue stability |
| Slow dependency (sleep in reconcile) | Worker starvation, P99 impact, queue depth growth |
| Operator pod restart mid-reconcile | Level-triggered correctness, no duplicate side effects |
| Shard rescale (increase shard count) | Rehash window safety, split-brain absence |
Load Generator
# Mass CR creation — 10k objects, batched to avoid fork-bombfor i in $(seq 1 10000); do kubectl apply -f - <<YAML &apiVersion: mygroup.example.com/v1kind: MyResourcemetadata: name: load-test-$i namespace: defaultspec: replicas: 1YAML if (( i % 100 == 0 )); then wait; fidone
Validating Idempotency
Run the same reconcile twice on an already-reconciled object and verify zero API writes on the second pass:
func TestReconcileIsIdempotent(t *testing.T) { // First reconcile — sets up state _, err := reconciler.Reconcile(ctx, req) require.NoError(t, err) // Capture baseline action count baselineActions := len(fakeClient.Actions()) // Second reconcile — nothing changed _, err = reconciler.Reconcile(ctx, req) require.NoError(t, err) // Count writes issued on second pass secondPassActions := fakeClient.Actions()[baselineActions:] writes := 0 for _, a := range secondPassActions { if a.GetVerb() != "get" && a.GetVerb() != "list" { writes++ } } assert.Zero(t, writes, "reconcile must be idempotent: second pass should issue no writes")}
What to Measure Under Load
- Queue depth over time — should reach steady-state, not grow unbounded
- P99 reconcile duration under load vs. at rest — the delta is your burst cost
- Operator pod memory at peak CR count — should be stable, not growing (GC pressure)
- API server request rate — should never exceed
cfg.QPSceiling - Error rate — should be zero under normal load, non-zero but bounded under injected failures
Common Anti-Patterns
These patterns appear regularly in operators that don’t scale. Each is a correctness or performance cliff that reveals itself under load.
Edge-triggered reconcile logic
Acting on event type or delta rather than current desired state. Correct at low scale where deduplication rarely collapses events; catastrophic at high scale where it’s constant.
Blind RequeueAfter on stable objectsRequeueAfter on every healthy object is self-inflicted polling. At 10k CRs with a 60-second poll, that’s ~167 reconciles/sec of pure no-op work saturating worker capacity.
Ignoring cfg.QPS and cfg.Burst
Leaving client-go at its default 5 QPS/10 burst means your operator is throttled by its own HTTP client. You won’t see 429s — you’ll see mysteriously slow reconciles as the client queues requests internally.
Listing the entire cluster on every reconciler.List(&pods) without namespace or label selectors walks the full cache. At 100k Pods, this is expensive in CPU and allocations — and usually unnecessary if field indexes are registered.
Writing status unconditionally
Updating status even when nothing changed creates a resourceVersion bump → watch event → potential reconcile enqueue. This is a feedback loop that generates load proportional to CR count × reconcile frequency.
Unbounded parallel API callserrgroup without a semaphore means a reconcile processing 500 children fires 500 concurrent API writes. At 50 concurrent reconciles, that’s 25,000 simultaneous requests — enough to saturate an API server.
Treating resync as a freshness mechanism
The informer cache is kept fresh by the Watch stream, not by resync. Resync is a correctness backstop. A short resync period doesn’t improve freshness — it floods the queue at regular intervals.
No per-shard queue depth monitoring
Without this, hot partitions are invisible until they produce latency SLO violations.
Using APIReader everywhere
Bypassing the cache with r.APIReader for all reads turns your operator into a direct API client on every reconcile. You lose all caching benefits and impose proportionally higher load on the API server. Use APIReader only for strongly-consistent reads where cache staleness is genuinely unacceptable — and treat each such call as spending from your QPS budget.
Putting It All Together: A Scaling Checklist
Throughput & Capacity
- [ ] Throughput model calculated:
min(workers/avg_duration, rate_limiter_QPS, api_server_capacity) - [ ] Drain time under thundering herd estimated and within SLO budget
- [ ]
cfg.QPSandcfg.Burstexplicitly set (not left at client-go defaults of 5/10) - [ ] APF FlowSchema + PriorityLevelConfiguration created for operator ServiceAccount
Reconcile Loop
- [ ] Reconcile is fully level-triggered — no dependency on event type or delta
- [ ] Reconcile is idempotent — second pass on already-reconciled object issues zero writes
- [ ] Reconcile duration P99 measured and within SLO budget
- [ ] Parallel API writes bounded by semaphore relative to
cfg.QPS - [ ] No unconditional
RequeueAfteron stable/healthy objects - [ ] Terminal errors set status condition and return
nil(no requeue)
Finalizers
- [ ] Finalizer cleanup is idempotent — safe to run multiple times
- [ ] Cleanup does not block workers on slow external systems — uses backoff + requeue
- [ ] Long-running cleanup progress tracked in status conditions, not just in-memory
- [ ]
operator_terminating_objects_totalmetric exposed and alerted on - [ ] Mass deletion load tested: Terminating count drains within deletion SLO
Write Amplification
- [ ] Server-Side Apply used for owned resource management
- [ ] Status updates guarded by deep equality check before writing
- [ ] Status writes batched to once per reconcile pass
- [ ] High-churn fields (counters, sub-second timestamps) absent from status
Rate Limiting & Queue
- [ ] Custom
RateLimiterset: global QPS ≈cfg.QPS / avg_writes_per_reconcile - [ ] Per-item backoff max tuned to recovery SLO (not left at 1000s default)
- [ ] Queue depth exposed as Prometheus metric and alerted on
- [ ] Queue depth diagnostic table understood and SLO breakpoints defined
Backpressure
- [ ]
GenerationChangedPredicateapplied to primary resource - [ ] Child-resource watch predicates filter to meaningful transitions only
- [ ]
429responses handled with fixed delay (not counted as item failures) - [ ] Thundering herd load tested: queue drains within SLO window, memory stable
Cache & Informers
- [ ] Cache scoped to relevant namespaces / label selectors
- [ ] Field indexes registered for all non-trivial
Listqueries - [ ] Resync period extended (≥ 1 hour at scale) with explicit correctness compensations
- [ ] Cache memory profiled at full CR count — pod limits set accordingly
- [ ] Unnecessary resource type watches removed
Sharding
- [ ] Sharding strategy chosen with trade-offs documented (label-based vs. hash-based)
- [ ]
MaxConcurrentReconcilesprofiled under full load per shard - [ ] Rehash window tested for split-brain absence
- [ ] Per-shard queue depth monitored independently
Observability & SLOs
- [ ] Operator SLO defined: “P99 of CRs reconciled within Xs of spec change”
- [ ] Reconcile lag metric instrumented (from spec change timestamp, not just reconcile duration)
- [ ] Queue depth + P99 duration + error rate alerts wired to SLO burn rate
- [ ] Structured per-stage reconcile logging in place
Load & Failure Testing
- [ ] Mass CR creation tested: queue drains within SLO window
- [ ] Mass CR deletion tested: Terminating backlog drains, no permanent leaks
- [ ] Finalizer cleanup with external system down tested: operator remains stable
- [ ] Thundering herd tested: rolling node restart simulation
- [ ] API server 429 injection tested: operator recovers without manual intervention
- [ ] Operator pod restart mid-reconcile tested: no duplicate side effects
- [ ] Shard rescale tested if applicable: no split-brain during rehash window
Closing Thoughts
Scaling an operator is not about adding workers — it’s about respecting system limits:
- The API server is finite. Your operator shares it with the entire cluster. The default client-go QPS settings assume you don’t.
- The queue is lossy by design. Events collapse. Intermediate states disappear. Your reconciler must treat this as a feature, not a bug.
- Writes amplify. One CR change becomes dozens of API calls becomes etcd fsyncs. At scale, every unnecessary write is a tax paid by every other controller in the cluster.
- Deletes are reconciles. Finalizers turn mass deletions into a throughput problem. A cleanup bottleneck can leave thousands of objects permanently Terminating.
If your reconcile loop is level-triggered, idempotent, and backpressure-aware, scaling becomes a tuning problem — and tuning problems are solved with data.
If not, scaling becomes a correctness problem. No rate limiter, no shard count, no HPA configuration will save a reconciler that acts on events instead of state.
Build the loop correctly first. Measure everything. Tune from data.
All code examples use controller-runtime ≥ v0.17 and Go 1.21+. APF configuration targets Kubernetes ≥ 1.26 (GA flowcontrol.apiserver.k8s.io/v1).

Leave a comment