
This post assumes Kubernetes 1.27+ and the
autoscaling/v2API. It targets senior ICs and platform engineers who operate autoscaling systems in production.
Table of Contents
- Prerequisites: Setting Up Your Lab Cluster
- Autoscaling Is a Multi-Loop System
- The Problem Space
- Horizontal Pod Autoscaler (HPA)
- The Control Loop
- HPA as a Delayed, Saturating P-Controller
- The End-to-End Reaction Time
- The Scaling Algorithm
- Multi-Metric Behavior
- CPU vs. External Metrics: An Explicit Tradeoff
- HPA v2 Scaling Policies
- The CPU Request Coupling Problem
- Metrics Pipeline
- Scale-to-Zero
- Vertical Pod Autoscaler (VPA)
- Architecture: Three Separate Components
- The Recommender: Statistical Core
- The Updater: The Disruptive Actor
- The Admission Controller: The Mutation Point
- HPA vs VPA: When to Use Which
- Cluster Autoscaler Interaction
- Operational Gotchas
- Autoscaling Failure Taxonomy
- Production Incident Pattern: The Black Friday Failure Mode
- Choosing an Autoscaling Strategy
- Production Design Pattern: A Battle-Tested Reference Architecture
- Cost Dynamics of Autoscaling
- What Experienced Engineers Actually Do
- Common Misconfigurations
- HPA Anti-Patterns
- VPA Anti-Patterns
- Observability: Metrics That Matter
- Summary
Prerequisites: Setting Up Your Lab Cluster
Before diving in, spin up a local kind cluster with metrics-server pre-configured. All exercises in this guide assume this setup.
# Install kind if you haven't alreadybrew install kind # macOS# or: curl -Lo ./kind https://kind.sigs.k8s.io/dl/v0.22.0/kind-linux-amd64 && chmod +x kind && mv kind /usr/local/bin/# Create a 3-node cluster (1 control-plane + 2 workers)cat <<EOF | kind create cluster --name autoscaling-lab --config=-kind: ClusterapiVersion: kind.x-k8s.io/v1alpha4nodes:- role: control-plane- role: worker- role: workerEOF# Install metrics-server (kind doesn't ship it)kubectl apply -f https://github.com/kubernetes-sigs/metrics-server/releases/latest/download/components.yaml# Patch metrics-server to work without TLS verification (required in kind)kubectl patch deployment metrics-server -n kube-system --type='json' \ -p='[{"op":"add","path":"/spec/template/spec/containers/0/args/-","value":"--kubelet-insecure-tls"}]'# Wait for metrics-server to be readykubectl rollout status deployment/metrics-server -n kube-system --timeout=60s# Verify it's working (may take ~30s after rollout)kubectl top nodes
Autoscaling Is a Multi-Loop System
Before diving into HPA and VPA internals, it is worth establishing the full system. Kubernetes autoscaling is not one controller — it is four independent control loops operating on different timescales and different variables:
| Loop | What it controls | Timescale |
|---|---|---|
| HPA | Replica count | Seconds to minutes |
| VPA | Per-pod resource requests | Minutes to hours |
| Cluster Autoscaler | Node count | Minutes |
| Scheduler | Pod placement | Milliseconds |
Most production autoscaling incidents do not occur because a single loop misbehaved. They occur because two loops reacted to the same signal on different timescales — HPA scaling out while VPA evicts, CA provisioning for a transient condition, the scheduler unable to place pods while CA is still bootstrapping. Understanding each loop in isolation is necessary but not sufficient. This post focuses on HPA and VPA, but always with awareness of how they interact with the broader system.
The Problem Space
Autoscaling is not “automatic scaling” — it is approximate control under delayed, noisy signals. It is two independent control systems manipulating different variables with incomplete information and non-zero lag. HPA and VPA operate on fundamentally different axes, use different control models, and interact with each other in ways that will cause production incidents if misunderstood. The goal of this post is to build the internal mental model needed to tune and debug them without flying blind.
🧠 Mental Model: Autoscaling is Approximation
Autoscalers operate on metrics that are sampled, aggregated, and delayed. They apply changes that take tens of seconds to minutes to materialize. Perfect elastic scaling is not achievable — only bounded approximation is. The engineering goal is not to eliminate the gap between supply and demand, but to constrain how large that gap can grow and how long it can persist.
Horizontal Pod Autoscaler (HPA)
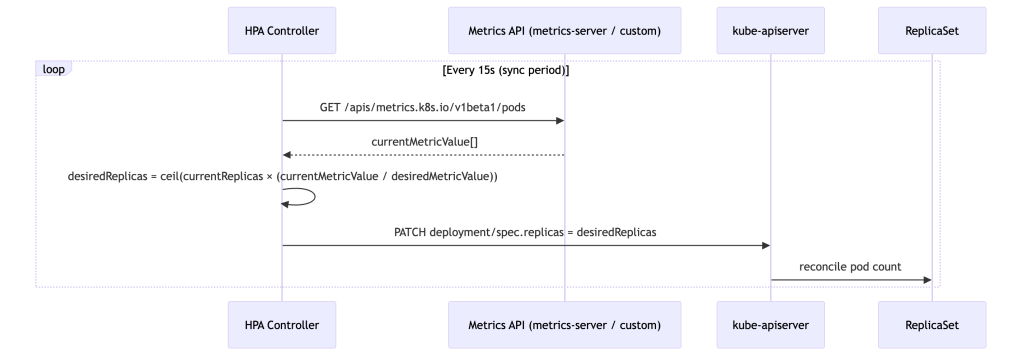
The Control Loop
HPA is a classic reconciliation controller running in kube-controller-manager. Every 15 seconds (configurable via --horizontal-pod-autoscaler-sync-period), it wakes up, samples metrics, computes a desired replica count, and patches the target’s spec.replicas.
HPA as a Delayed, Saturating P-Controller
HPA is not just a proportional controller — it is a delayed, rate-limited, saturating P-controller operating on a lagging signal. It reacts to the instantaneous ratio between observed and desired metric values with no integral or derivative terms. This framing matters because it predicts failure modes precisely:
- No integral term: Steady-state error persists. If your metric target is set too high, HPA will converge to a replica count that satisfies the ratio on paper but still leaves the service under-provisioned relative to actual demand.
- No derivative term: HPA cannot anticipate spikes. It has no model of metric velocity or acceleration — only current deviation from target.
- High phase lag: The 75–135 second reaction chain means HPA is always responding to load conditions that no longer exist at the moment the new pods are ready.
- Hard saturation:
minReplicas/maxReplicasand scaling policies create non-linear saturation effects. At saturation boundaries, the proportional response is simply clipped.
This combination makes HPA inherently prone to limit cycles under bursty load: it oscillates between under-provisioned and recovering states because it cannot hold position at steady state under noisy input. Stabilization windows exist as bolt-on hysteresis mechanisms rather than intrinsic damping — they reduce oscillation frequency but do not eliminate the underlying phase lag.
🧠 Mental Model: HPA Buys Time, Not Capacity
HPA does not handle spikes — it reacts after the spike has already started. Your system must survive the first 75–135 seconds without any additional pods. Conservative CPU targets (50–65%), generous
minReplicas, and pre-warmed capacity buffers are not timidity — they are the engineering response to a controller with 90+ second phase lag.
The End-to-End Reaction Time
A critical mental model that most teams lack is a quantified timing chain. When traffic spikes, the time before new pods are actually serving requests is approximately:
Total Reaction Time ≈ metric scrape interval (~15s for metrics-server)+ metrics aggregation lag (~15s)+ HPA sync period (~15s)+ pod startup time (20–60s depending on image and init)+ readiness probe delay (10–30s)─────────────────────────────────────Realistic range: 75 – 135 seconds
This means that under a sharp traffic spike, your service absorbs load for over a minute before a single additional pod is ready. Setting CPU targets at 80–90% leaves no headroom for that window. Conservative targets (50–65%) exist precisely to buy time for this pipeline to execute.
🧪 Exercise 1: Observe the HPA Reaction Time Pipeline
Deploy a simple CPU-bound workload and watch the timing chain in action.
Step 1: Deploy the target workload
Step 2: Create an HPA targeting 50% CPU
Step 3: Generate load and timestamp the spike
Step 4: Measure the delay
What to observe: Note the timestamp when you started the load vs. when the first
SuccessfulRescaleevent appears. You should see roughly 45–90 seconds of lag. Compare the gap against the timing chain formula above.Expected signal shape if you were graphing this:
- CPU utilization: sharp spike within 15s of load start
- Replica count: flat for 45–90s, then a step increase
- Phase lag between CPU spike and replica step is the controller’s entire reaction pipeline made visible
- After scaling, CPU drops as load spreads across new pods — but there is typically a secondary spike as readiness probes pass and traffic routing catches up
Stop the load:
Ctrl+Cin the load-generator terminal. The pod will self-delete (it was--rm).
The Scaling Algorithm
The core formula:
desiredReplicas = ceil[currentReplicas × (currentMetricValue / desiredMetricValue)]
Several stabilizing mechanisms layer on top:
Stabilization windows prevent oscillation. Because HPA lacks intrinsic damping, stabilization windows act as an external hysteresis mechanism. The controller maintains a rolling window of past recommendations. For scale-down, it selects the maximum recommendation seen during the window (default: 300s), preventing premature scale-in. For scale-up, it selects the minimum recommendation (default: 0s — acts immediately). This asymmetry is intentional: be aggressive about adding capacity, conservative about removing it. CA mirrors this philosophy at the node level — its scale-down is even more conservative, with a default 10-minute idle delay before a node is considered for removal. Both loops are deliberately slow to release capacity.
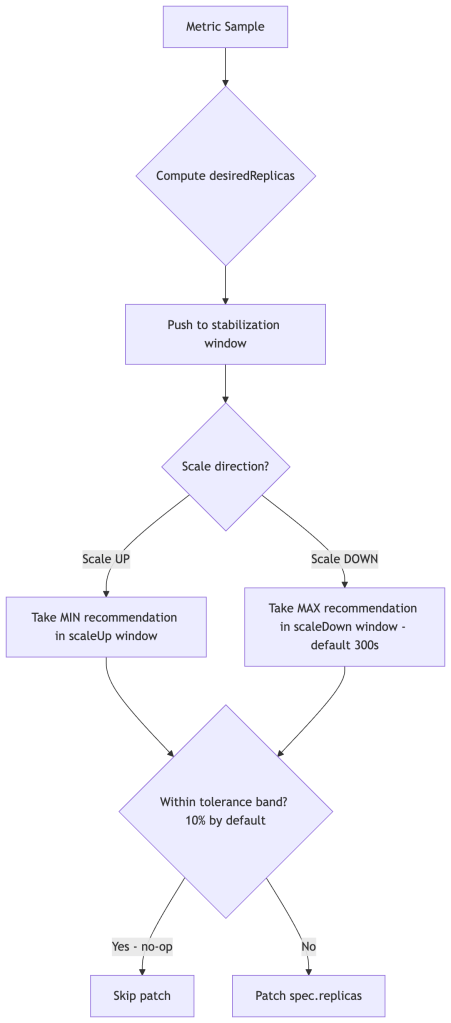
Tolerance (default 0.1 = 10%) means HPA won’t act if currentValue is within 10% of targetValue, preventing constant micro-adjustments under noisy metrics.
Missing pod handling: For pods that have no metrics (not yet Running, or mid-startup), HPA applies a conservative heuristic. During scale-up, it assumes those pods are consuming 100% of target utilization to avoid under-scaling. During scale-down, it assumes they are at target-level utilization to avoid premature scale-in. They are not assumed to be idle.
🧪 Exercise 2: Verify the Stabilization Window During Scale-Down
This exercise makes the 300-second scale-down stabilization window visible. You’ll drive scale-up, stop the load, and watch HPA refuse to scale down immediately.
Setup (continuing from Exercise 1, or re-run setup):
Generate load until HPA scales out to 3+ replicas:
Stop load and record the time:
What to observe: After load stops, CPU will drop immediately, but HPA will hold replica count for ~5 minutes before scaling down. This is the 300-second
scaleDownstabilization window in action.Shortcut the wait — override the stabilization window:
Key insight: The default 300s window exists to prevent flapping. Override it with care — a too-aggressive scale-down policy can cause oscillation under bursty traffic.
Multi-Metric Behavior
computeReplicasForMetrics in pkg/controller/podautoscaler/ iterates over all configured metrics and takes the maximum desired replica count — metrics are not averaged. Consider a service configured with both CPU and RPS targets:
| Metric | Current | Target | Desired Replicas |
|---|---|---|---|
| CPU | 70% | 50% | 6 |
| RPS | 800 | 400 | 10 |
HPA sets replicas = 10, driven by RPS. This is mathematically correct but operationally dangerous when one metric is noisy or misconfigured — a spurious spike in any single metric drives the entire replica count up. Monitor individual metric recommendations, not just the resulting replica count.
CPU vs. External Metrics: An Explicit Tradeoff
The choice of HPA signal is one of the highest-leverage tuning decisions you make. Most teams default to CPU because it requires no additional pipeline — but that convenience has a cost:
| Dimension | CPU | RPS / Queue Depth |
|---|---|---|
| Signal freshness | ❌ Lagging (scrape + aggregation + sync = 45s+) | ✅ Near-real-time |
| Infra independence | ✅ Always available | ❌ Requires metrics pipeline (Prometheus Adapter, KEDA) |
| VPA coupling risk | ❌ High — VPA changes requests, distorts utilization ratio | ✅ None — orthogonal signal |
| Throttling blind spot | ❌ Throttled CPUs appear underloaded | ✅ Not affected |
| Stability | ✅ High — noisy workloads still converge | ⚠️ Lower — noisy metrics drive unnecessary scale events |
| Failure mode | Under-scaling (HPA reacts too late) | Over-scaling (transient metric spikes) |
CPU is safer to configure but slower to react and couples badly with VPA. RPS is faster and decoupled, but requires a functioning metrics pipeline and careful target setting. Production systems often blend both — RPS as the primary signal with a CPU ceiling to catch cases where the metrics pipeline has a gap.
🧠 Mental Model: VPA is a Batch System Disguised as Real-Time
VPA reacts on a timescale of minutes to hours, applies changes via pod restarts, and builds recommendations from historical data. Treat it as an offline optimizer that runs continuously in the background — not a real-time controller. Its job is to right-size pods between load cycles, not to respond to them.
HPA v2 Scaling Policies
A commonly overlooked feature of autoscaling/v2 is scaling rate policies. These cap how fast replica counts can change, and in practice they are more important than stabilization windows for protecting downstream systems from traffic amplification during burst scale-out:
behavior: scaleUp: policies: - type: Percent value: 100 # at most double replicas per period periodSeconds: 60 - type: Pods value: 4 # or add at most 4 pods per period periodSeconds: 60 selectPolicy: Min # use whichever is more conservative scaleDown: policies: - type: Percent value: 10 periodSeconds: 120
Without explicit policies, a sudden load spike can cause HPA to jump from 3 to 50 replicas in a single sync cycle. Rate-limiting scale-out smooths the curve and gives downstream dependencies time to adapt.
🧪 Exercise 3: Observe Unconstrained vs. Rate-Limited Scale-Out
This exercise demonstrates why scaling rate policies matter. You’ll compare the replica jump with and without a
Podsrate cap.Step 1: Deploy a fresh workload with low CPU requests (makes it easy to saturate)
Step 2: Create an HPA without rate policies
Step 3: Blast it with load and watch the replica jump
Step 4: Kill load, reset, and add a rate policy
What to observe: With no policy, replicas may jump 2→10+ in a single cycle. With the 2-pods-per-30s cap, the scale-out is gradual. Neither is always “better” — this illustrates the tradeoff between responsiveness and stability.
Cleanup:
The CPU Request Coupling Problem (Why VPA Breaks CPU HPA)
This is the most architecturally significant HPA pitfall that teams consistently miss. CPU utilization in HPA is computed relative to the pod’s requested CPU, not actual node capacity:
cpuUtilization = currentCPUUsage / requestedCPU
This creates direct coupling between resource requests and scaling behavior. If you over-request CPU (e.g., requests: 2000m for a service that realistically uses 400m), computed utilization is suppressed — HPA sees a low percentage and refuses to scale out even under genuine load. Conversely, under-requesting CPU inflates utilization and causes premature scale-out.
This is why VPA and HPA must be used together carefully: VPA continuously adjusts requests, which directly shifts HPA’s utilization baseline. Run them on separate metrics or you get a feedback loop.
🧪 Exercise 4: Demonstrate CPU Request Coupling
This exercise shows how the same real CPU usage produces different HPA behavior depending on the resource request value.
Step 1: Deploy with a very high CPU request (simulates over-provisioning)
Step 2: Generate load and observe the HPA metric value
Step 3: Reset with a realistic request and observe the difference
What to observe: The same real CPU usage produces a dramatically different utilization percentage depending on the request. With
1000mrequest, HPA may show 15-20% and not scale. With100mrequest, the same workload shows 150-200%+ and triggers aggressive scale-out. This is exactly the feedback loop that emerges when VPA adjusts requests while CPU-based HPA is running.Cleanup:
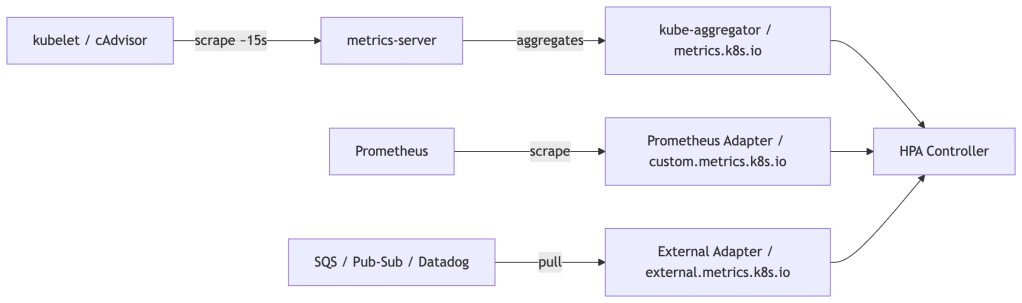
Metrics Pipeline
HPA talks to one of three metrics APIs:
metrics.k8s.io— Resource metrics (CPU/memory) served bymetrics-server, which scrapes kubelet’s Summary API at ~15s resolution. End-to-end metric freshness (scrape + aggregation + HPA sync cycle) still introduces meaningful lag of 30–60s under normal conditions.custom.metrics.k8s.io— Arbitrary per-object metrics. Backed by adapters like Prometheus Adapter or Datadog Cluster Agent.external.metrics.k8s.io— Metrics external to the cluster (queue depths, SQS, etc).
The latency consequence: CPU-based HPA reacts to load that has already materialized. For latency-sensitive services, augment with external or custom metrics that reflect current load (active connections, queue depth, RPS) rather than CPU, which lags by the full pipeline round-trip.
Scale-to-Zero
minReplicas defaults to 1 but can be set to 0 in autoscaling/v2. However, CPU-based scaling cannot recover from zero — there are no pods to report metrics. Scale-to-zero is only viable with external or object metrics, where the metric source exists independently of pod count. In practice, KEDA is the standard solution, as it manages the activator component needed to bridge the zero-to-one cold-start gap.
Vertical Pod Autoscaler (VPA)
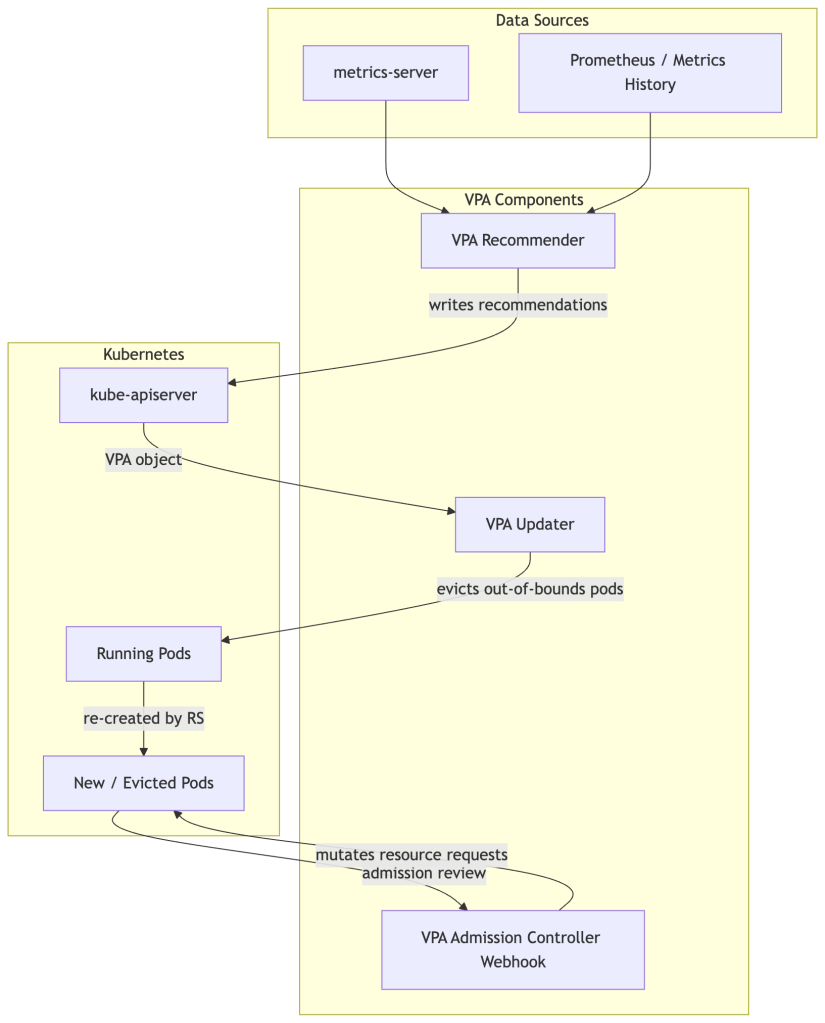
Architecture: Three Separate Components
Unlike HPA (a single controller loop), VPA is split into three distinct processes with distinct responsibilities and failure modes:
🧪 Exercise 5: Install VPA and Observe Recommendations
Install the VPA components and run it in
Offmode first — as a pure recommendation engine, with no evictions. This is the safest first step for any production environment.Step 1: Install VPA from the official repo
Step 2: Deploy a workload to monitor
Step 3: Create a VPA in
Offmode (recommendation only)Step 4: Wait ~5 minutes for recommendations to populate, then inspect
What to observe: The
status.recommendation.containerRecommendationssection showslowerBound,target, andupperBoundfor both CPU and memory. Compare these against your manifest’s requests. The gap is your rightsizing debt.Key things to note:
- The memory recommendation is likely much higher than
50Mi(processes have real overhead)- The CPU recommendation may differ significantly from
100m- These are updated continuously as the workload runs
The Recommender: Statistical Core
The Recommender maintains an in-memory histogram of CPU and memory usage per container, modeled as a decay-weighted percentile estimator. Older samples are down-weighted exponentially, giving more influence to recent behavior while retaining long-tail signal.
The histogram uses exponential bucket boundaries — each bucket is ~10% wider than the previous, enabling compact representation across orders of magnitude of resource values.
Two important asymmetries in how CPU and memory are modeled:
Memory uses peak samples, not averages. Since memory is not compressible (a process that allocates 2GB cannot be throttled down to 1GB without an OOMKill), the Recommender intentionally biases toward observed peaks rather than typical usage. This makes memory recommendations more conservative than CPU by design.
CPU recommendations smooth over bursts. CPU is compressible — throttling slows a process but doesn’t kill it. The recommender uses a smoother model for CPU, accepting that brief spikes will be throttled rather than sizing for them. However, this creates a blind spot: if CPU limits are enforced aggressively, throttling suppresses the observed usage signal, making VPA’s histogram reflect artificially low CPU consumption. The Recommender cannot distinguish “this container uses 200m” from “this container is throttled at 200m.” If you see VPA recommending low CPU while your application has high p99 latency, check container_cpu_throttled_seconds_total before trusting the recommendation.
Key estimation parameters:
- Target percentile: CPU recommended at p90 of observed usage; memory at p95. Both are configurable.
- Safety margin:
+15%added on top of the percentile estimate (configurable via--recommendation-margin-fraction). - Confidence: For containers with sparse samples, confidence intervals widen and recommendations inflate conservatively.
Critically, the Recommender produces three values written to VPA.status.recommendation:
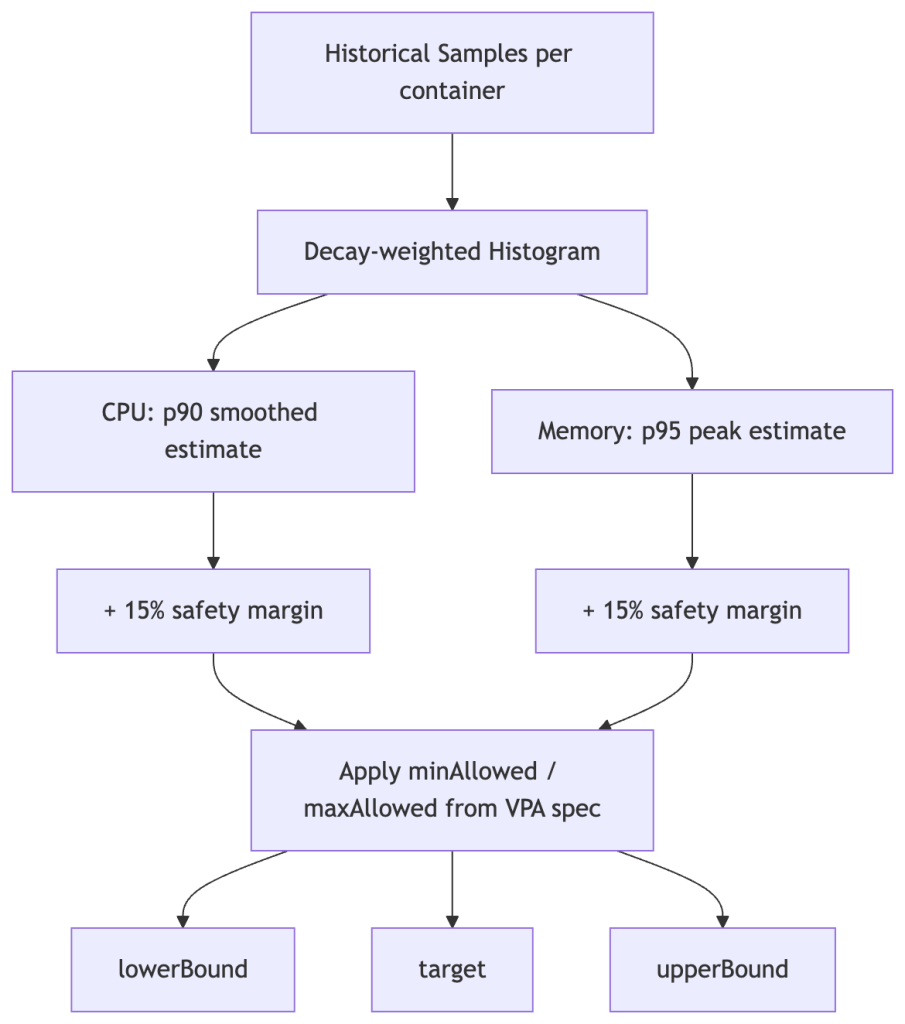
The Updater only evicts a pod if its current requests fall outside the [lowerBound, upperBound] range — not every time the target shifts. This prevents constant churn under normal variance.
The Updater: The Disruptive Actor
The Updater runs every 1 minute. If a pod’s current requests are outside the recommended bounds, the Updater evicts it. The pod is recreated by its owning controller, and the Admission Webhook intercepts that new pod creation to inject the updated requests.
Two important constraints on Updater behavior:
PodDisruptionBudgets are respected. If a PDB is too strict, or the workload is running at minimum replicas, VPA will refuse to evict and silently do nothing. Teams often discover this when VPA appears “stuck” — recommendations update in .status but pods never change. Check PDB disruptions allowed if VPA seems inert.
It requires pod restarts. In-Place Pod Vertical Scaling (KEP-1287) is beta in recent Kubernetes releases but requires feature gates and has provider-specific support constraints. Do not assume it is available without verifying your cluster version and managed Kubernetes provider.
For stateful workloads, control eviction behavior explicitly:
updatePolicy: updateMode: "Off" # Recommendations only — never evict # updateMode: "Initial" # Inject on creation, never evict running pods # updateMode: "Auto" # Full lifecycle management (default)
Starting with Off and using VPA as a recommendation engine is the safest posture for stateful workloads. Apply recommendations via a GitOps pipeline or scheduled maintenance window.
🧪 Exercise 6: Observe VPA Auto Mode and the PDB Blocker
This exercise demonstrates VPA’s Auto mode evicting pods, then shows how a PDB silently blocks it.
Part A: Enable Auto mode and watch the eviction
What to observe: The new pods will have different
requeststhan what’s in the Deployment spec. The VPA Admission Controller mutated them at pod creation time. Runkubectl get deployment hamster -o yaml | grep -A5 resources— the Deployment spec is unchanged. This is the “advisory manifest” behavior described in the Admission Controller section.Part B: Create a PDB that blocks eviction
What to observe: The VPA status will show the recommendation is out of bounds, but the pod is not evicted. The PDB shows
Disruptions Allowed: 0. This is the “VPA appears stuck” scenario described in the Updater section.Cleanup:
The Admission Controller: The Mutation Point
When a pod creation request reaches the API server, the VPA Admission Controller (MutatingWebhookConfiguration) intercepts it, looks up the VPA object for the pod’s owner, and overwrites resources.requests in the pod spec before it is persisted.
Your Deployment YAML’s resource requests become advisory at runtime — VPA owns the actual values. This is intentional but can surprise teams who expect kubectl get pod -o yaml to match their manifests.
🧪 Exercise 7: Confirm the Admission Webhook Mutation
This is a quick but important exercise to internalize that VPA mutates pods at creation time, making manifests advisory.
Step 1: Inspect the MutatingWebhookConfiguration
Step 2: Check the current VPA mode
Before restarting pods, confirm which update mode VPA is in:
⚠️ If the mode is
Off, the Admission Webhook will not mutate pod requests — the pod spec will match the Deployment manifest exactly. This is expected. You must switch toInitial(Step 3) to observe the mutation.Step 3: Switch to
Initialmode to enable webhook mutation
Initialmode instructs VPA to inject recommendations at pod creation time, but never evict running pods. This is the safest mode to observe mutation without disruption:Step 4: Restart pods and compare requests
What to observe: The pod’s actual CPU and memory requests should now differ from the Deployment manifest — they reflect VPA’s recommendation values injected by the Admission Webhook at pod creation time. The Deployment spec itself is unchanged; VPA only mutates the live pod spec.
💡 If requests still match after switching to
Initialmode, VPA may not have built up enough sample history yet to generate a recommendation. Wait 2–3 minutes and check:kubectl describe vpa hamster-vpa | grep -A10 "Recommendation:". If theRecommendationsection is empty, give the workload more time to run before restarting.Step 5: Reset VPA mode
HPA vs VPA: When to Use Which
The safe combination rule: Never run HPA and VPA on the same metric. If HPA is managing CPU utilization while VPA is adjusting CPU requests, they form a destabilizing positive feedback loop:
- VPA increases CPU requests
- Same real CPU usage is now a smaller fraction of the larger request — HPA utilization drops
- HPA scales in (fewer replicas)
- Load concentrates on remaining pods — per-pod CPU rises
- VPA observes higher per-pod usage, increases requests further
- Repeat
This loop does not converge. It oscillates with each VPA eviction cycle acting as a perturbation that resets the HPA signal. The safe pattern is HPA on external/custom metrics (RPS, queue depth, active connections) with VPA managing CPU/memory requests. Operating on orthogonal signals, the two controllers cannot interfere with each other’s feedback paths.
🧪 Exercise 8: Reproduce the HPA + VPA Feedback Loop
This is the most important exercise in the guide. You will deliberately create the feedback loop described above and observe it destabilize replica count.
Step 1: Deploy a workload with both CPU-based HPA and VPA in Auto mode
Step 2: Apply moderate, sustained load
What to observe: VPA will adjust CPU requests upward. Each time it does, the same real CPU usage becomes a smaller percentage of the new (larger) request. HPA sees lower utilization and scales in. Fewer pods means more load per pod. VPA observes higher per-pod CPU and adjusts requests further. Watch for oscillation in replica count.
Step 3: Fix it — switch HPA to a non-CPU metric
In a real cluster you’d use RPS from Prometheus. In kind, use a
ContainerResourcemetric on memory instead (orthogonal to CPU), or simply document that the fix is to replace CPU-based HPA with an external/custom metric.Cleanup:
Cluster Autoscaler Interaction
HPA and VPA both create pressure on the node pool, but on different timescales and through different mechanisms.
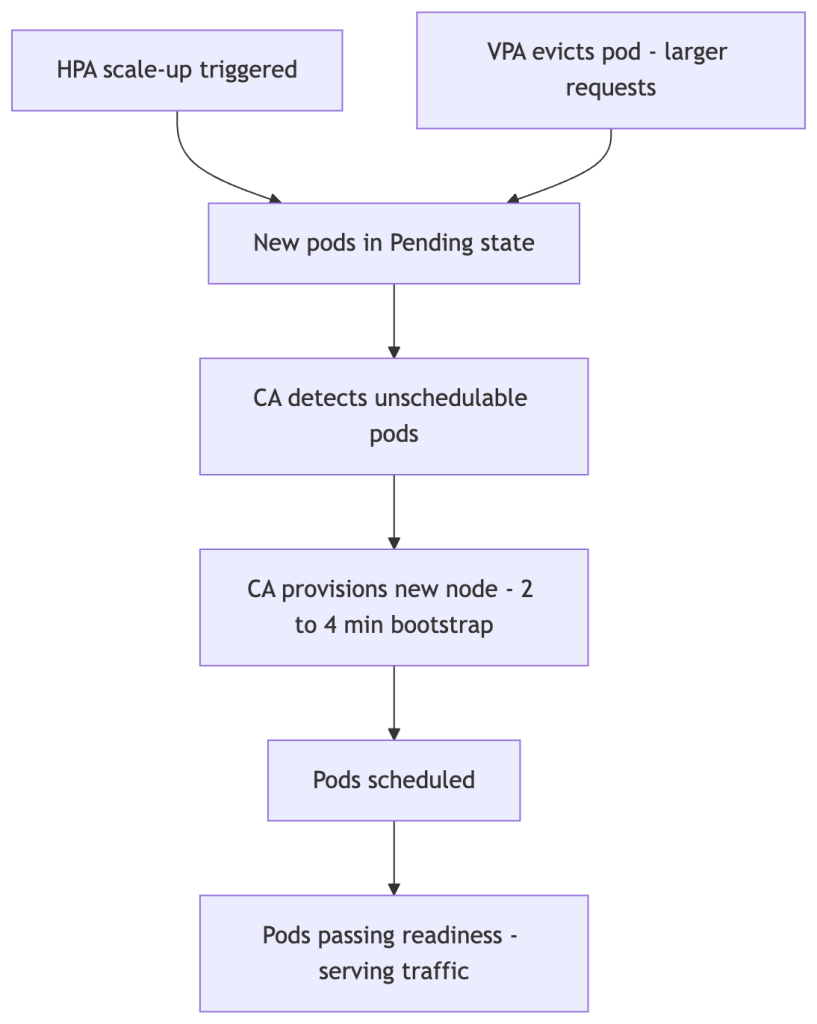
HPA is fast. CA is slow. Node bootstrap time is the dominant constant in the system — every autoscaling strategy is bounded by it. The 2–4 minute bootstrap lag (longer for GPU or large instance types) sets a hard floor on how quickly new capacity can serve traffic. Any strategy that relies on CA to absorb spikes has accepted this floor as a design constraint.
CA solves local schedulability, not global efficiency. CA provisions enough nodes to schedule the pods that are currently Pending. It does not optimize bin-packing across the cluster — it does not rebalance existing pods, consolidate fragmented nodes, or optimize for cost. This is why VPA can increase node count even when actual CPU utilization is low: the scheduler makes placement decisions based on requests, not observed usage. VPA inflates requests → pods no longer fit on existing nodes → CA provisions new nodes → actual utilization stays flat or even falls. The cluster grows without the workload growing.
VPA raises the node pressure threshold — and can increase your bill. VPA increases requests, not limits. Larger requests make pods harder to schedule on existing nodes, pushing CA to provision additional capacity or larger instance types. This silently changes your node pool’s instance shape economics. You may end up with fewer, larger nodes than intended — or more total nodes — without any increase in actual cluster utilization. Monitor instance type distribution and node count trends after enabling VPA in Auto mode; the cost impact will appear there before it shows up in billing reports.
🧠 Mental Model: Requests Drive Cost, Not Usage
In Kubernetes, you pay for what you reserve, not what you use. The scheduler, the bin-packer, and CA all operate on
requests. VPA optimizesrequests. This means every VPA recommendation upward is a potential cost event — even if actual utilization is unchanged.
Autoscaling optimizes for performance first, cost second unless explicitly constrained. HPA and VPA have no cost objective — they optimize to keep the metric within bounds. Over-scaling is operationally safer than under-scaling from their perspective. If cost matters (it always does), you need to encode it through maxReplicas, maxAllowed bounds, and node pool configuration — the autoscalers will not self-constrain.
Prevent CA overshoot: If VPA evicts a large batch of pods simultaneously, the scheduler may not fit them all, triggering CA to provision capacity for a transient condition. Stage transitions between VPA updateMode values, and consider CA’s --scale-down-delay-after-add to prevent immediate scale-in after a VPA-triggered provisioning event.
Overprovisioning buffers address the CA latency problem directly. Deploy a Deployment of low-priority placeholder pods (using a PriorityClass with a negative value) sized to your expected burst headroom. These pods consume cluster capacity when idle, keeping nodes warm and schedulable. When real pods scale out, the scheduler evicts the placeholder pods to make room — no CA provisioning required. The cost is always-on reserved capacity; the benefit is eliminating the 2–4 minute bootstrap lag from your scaling critical path.
🧪 Exercise 9: Trigger Pending Pods via VPA Request Inflation
In kind, nodes have fixed resources. You can reproduce the VPA-inflates-requests-causing-unschedulable scenario by setting
maxAllowedto values larger than your kind node’s allocatable capacity.What to observe: After VPA injects the inflated requests, some pods may enter
Pendingstate because no single node has enough remaining allocatable resources. In a real cluster, this is the trigger for Cluster Autoscaler to provision new nodes.Cleanup:
Operational Gotchas
VPA’s OOM learning problem: VPA recommends based on observed usage. If your application hasn’t experienced peak load during the observation window, VPA will under-recommend memory. An OOMKill resets the histogram’s confidence weighting. Always set minAllowed bounds anchored to values from load testing, not from observed idle-state usage.
CPU throttling blindspot: If your containers have tight CPU limits, container_cpu_throttled_seconds_total will be high but observed CPU usage will appear low. VPA will recommend lower CPU requests, worsening the throttling. Always check the throttling metric before acting on VPA CPU recommendations.
Memory target at p95 is not a ceiling: VPA recommends memory at p95, meaning 5% of observed samples exceeded the recommendation. For workloads with heavy GC or periodic batch operations, the tail can be large. Setting maxAllowed memory without headroom above p95 will still produce OOMKills at peak.
🧪 Exercise 10: Inspect VPA Recommendations Under CPU Throttling
This exercise demonstrates the CPU throttling blindspot: tight limits cause VPA to recommend less CPU, creating a vicious cycle.
Step 1: Deploy with intentionally tight CPU limits
Step 2: Check throttling and VPA recommendation
What to observe: Even though the container is burning 100% CPU,
kubectl topshows only ~200m (the limit). VPA sees this capped observation and may recommend a value near or below the current request. In a real environment, you’d checkcontainer_cpu_throttled_seconds_totalin Prometheus to confirm throttling.Cleanup:
Autoscaling Failure Taxonomy
Production autoscaling incidents tend to fall into a small number of reusable classes. Naming them makes debugging faster — you can pattern-match a symptom to a class before you have the full picture.
| Failure Class | Root Cause | Observable Symptom | Canonical Example |
|---|---|---|---|
| Lag-induced saturation | Reaction pipeline slower than load ramp | High error rate for 90–120s before replicas increase | CPU HPA at 80% target + sudden 3× traffic spike |
| Signal distortion | Metric ≠ actual load | VPA recommends lower CPU despite high latency | CPU throttling suppresses observed usage |
| Control loop interference | Two loops reacting to the same signal | Oscillating replica count without load change | CPU-based HPA + VPA Auto mode running simultaneously |
| Capacity illusion | Scheduler or CA lag hides true capacity deficit | Pods Pending despite “sufficient” cluster capacity | VPA evicts pods during CA bootstrap window |
| Overcorrection / oscillation | Aggressive scale policies or too-low stabilization window | Replica count thrashes up and down under steady load | scaleDown.stabilizationWindowSeconds: 0 on noisy metric |
| Bound-induced blindness | maxReplicas or maxAllowed set too conservatively | ScalingLimited condition True; SLO degraded but HPA appears healthy | maxReplicas: 5 on a service that needs 20 during peak |
When an autoscaling incident starts, the first question is: which class is this? The answer determines whether you look at metric freshness, HPA/VPA coupling, scheduler events, or policy configuration.
Production Incident Pattern: The Black Friday Failure Mode
Consider a typical API service under sudden high load:
- Traffic spikes 5× over 2 minutes.
- CPU metrics are ~30s stale. HPA does not yet see elevated utilization.
- HPA eventually fires — but CPU target was set at 80%. The service is already saturated before the first new pod starts.
- VPA, running in
Automode, decides this is a good time to evict two pods to update their memory requests. Pod count temporarily drops. - The evicted pods cannot fit on existing nodes due to larger VPA-requested resources. CA begins provisioning — with a 2–4 minute bootstrap lag.
- By the time new capacity is available, the load spike has peaked and is declining. CA provisions nodes that are no longer needed.
The fix is not a single knob. It requires: external metrics for HPA (RPS instead of CPU), VPA in Initial mode during high-risk windows, CA warm pools or overprovisioning buffers, and load-tested minAllowed VPA bounds.
🧪 Exercise 11: Simulate the Black Friday Failure Mode End-to-End
This pulls together HPA, VPA, and the scheduler to reproduce the scenario.
Step 1: Deploy the reference “API service”
Step 2: Apply a sudden 5× load spike
What to observe over ~10 minutes:
- Initial delay before HPA fires (metric lag + sync period)
- VPA evicting a pod during the spike (pod count temporarily drops)
- HPA and VPA fighting over replica count
- If pods request more resources after eviction, potential scheduling pressure
Step 3: Apply the fix and compare
Cleanup everything:
Choosing an Autoscaling Strategy
Given a workload, how do you decide what to configure? The right answer depends on the workload’s scheduling properties, traffic shape, and operational risk tolerance — not on what’s easiest to configure.
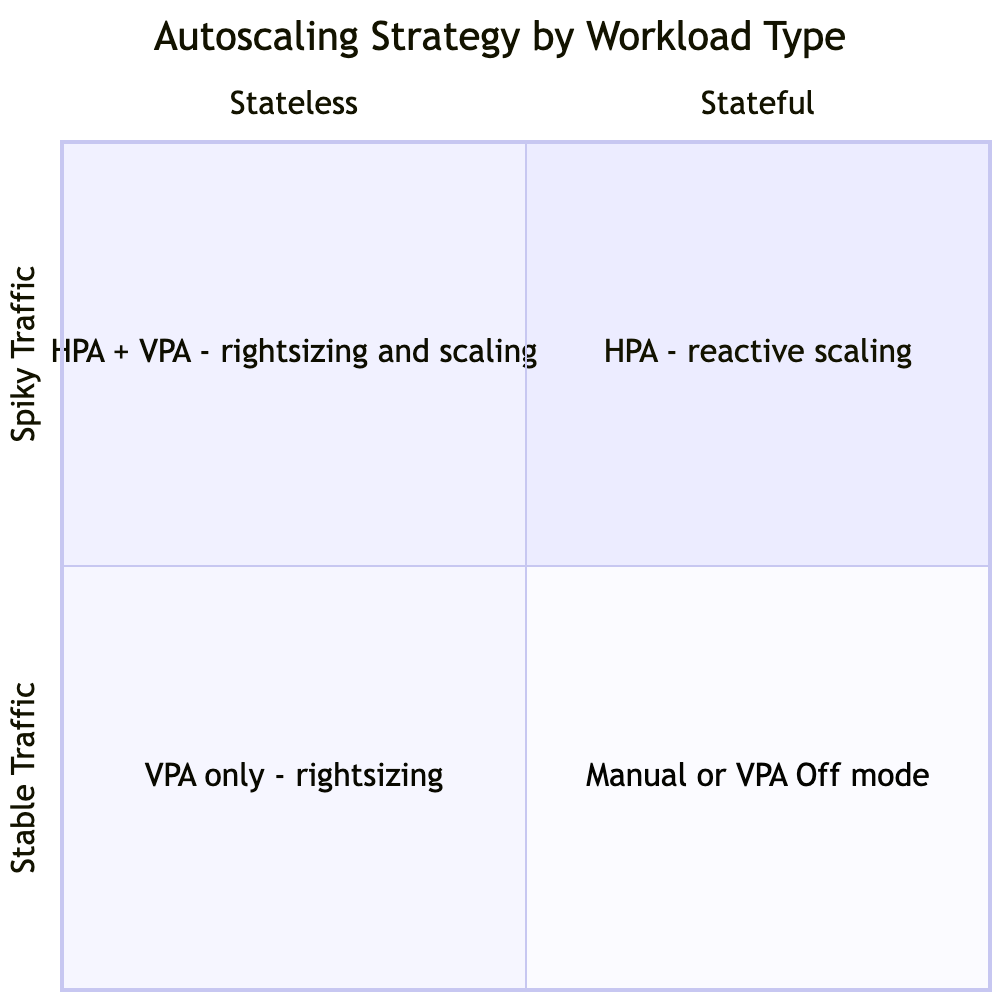
Workload is stateless and traffic is spiky? → HPA with external metric (RPS or queue depth) → Add CPU as a secondary ceiling if external pipeline is unreliableWorkload is stateful (database, queue, cache)? → VPA in Off or Initial mode only — use recommendations to right-size at deploy time → HPA only if the workload supports safe horizontal scalingTraffic is queue-driven (async workers, batch processors)? → KEDA with queue-depth metric — HPA's pull-based model is a poor fit for push-based workWorkload is latency-sensitive (p99 SLO < 100ms)? → HPA with headroom baked into the target (50% CPU or lower, not 80%) → Overprovisioning buffer to absorb the CA bootstrap window → VPA in Initial mode; never AutoCPU-bound workload with well-understood load curve? → HPA on CPU is acceptable if: target ≤ 60%, minReplicas absorbs the reaction window, and VPA is on an orthogonal metric or in Off modeYou are starting from scratch with no load data? → VPA in Off mode for 1–2 full traffic cycles to collect recommendations → Use recommendations to set initial requests, then graduate to HPA
The general principle: configure autoscaling conservatively (lower CPU targets, wider stabilization windows, explicit maxReplicas) and then loosen based on observed behavior. The failure modes of over-conservative configuration (slightly higher cost, slightly slower reaction) are far more recoverable than the failure modes of over-aggressive configuration (oscillation, cascading evictions, CA thrash).
Production Design Pattern: A Battle-Tested Reference Architecture
For a stateless, latency-sensitive service that you want to operate safely at scale:
# HPA: scale on RPS, not CPUmetrics:- type: External external: metric: name: http_requests_per_second target: type: AverageValue averageValue: "400"# Scaling policies: don't surge, don't collapsebehavior: scaleUp: policies: - type: Percent value: 50 periodSeconds: 60 selectPolicy: Min scaleDown: stabilizationWindowSeconds: 300 policies: - type: Percent value: 10 periodSeconds: 120
Pair this with VPA in Initial mode:
updatePolicy: updateMode: "Initial" # inject at pod creation, never evict running podsresourcePolicy: containerPolicies: - containerName: "*" minAllowed: cpu: 100m memory: 256Mi # anchored to load test p99 maxAllowed: cpu: 4 memory: 4Gi
And complete the stack with:
- CA warm pool or overprovisioning buffer (low-priority placeholder pods that get evicted first, keeping spare capacity pre-warmed)
- CPU requests tuned to p50 load (not observed idle), informed by VPA recommendations after a full traffic cycle
--scale-down-delay-after-addon CA set to at least 10 minutes to prevent thrashing after a provisioning event
This architecture means HPA scales on a signal with no CPU-request coupling, VPA rightsizes without disrupting running pods, and CA only sees pressure from genuine, sustained scheduling demand.
Cost Dynamics of Autoscaling
Autoscalers have no cost objective — they optimize to keep metrics within bounds. This means cost consequences are entirely a function of how you constrain them.
HPA cost profile: Over-scaling costs money (idle pods billed at full rate). Under-scaling costs SLO attainment. The tradeoff is asymmetric: SLO violations have reputational and sometimes contractual consequences; idle capacity has a predictable cost. Most production systems err toward over-scaling by design, using minReplicas floors that keep pods warm even during off-peak hours. The cost of that floor is the explicit price of low-latency reaction.
VPA cost profile: VPA’s cost impact is indirect and counterintuitive. By inflating requests, VPA can reduce bin-packing efficiency — larger requests mean fewer pods per node, which means more nodes for the same actual workload. The mechanism: CA provisions for request pressure, not usage pressure. A cluster running at 30% actual CPU utilization but 90% request utilization looks fully packed to CA. VPA can worsen this by pushing requests upward toward observed peaks. Track both actual utilization and request utilization as separate metrics.
CA cost profile: CA cost is a step function — it changes in node increments. This creates a zone of structural over-provisioning: the last node in a pool will typically carry only whatever load couldn’t fit elsewhere, but it is billed the same as a fully loaded node. Overprovisioning buffer pods deliberately fill this slack, converting the wasted allocation into controlled headroom rather than accidental waste.
The lever most teams forget: maxAllowed in VPA and maxReplicas in HPA are your primary cost controls. Without explicit upper bounds, both systems will scale toward whatever is needed to satisfy the metric — with no regard for what that costs. Set these bounds based on cost budgets, not just technical ceilings.
What Experienced Engineers Actually Do
Theory and configuration syntax are table stakes. The harder-won knowledge is what practitioners actually run in production after a few incidents:
On metric selection: RPS or queue depth as the primary HPA signal, with CPU as a secondary ceiling to catch cases where the metrics pipeline has gaps or delays. CPU-only HPA is treated as a legacy pattern to migrate away from when the metrics infrastructure is available.
On VPA modes: Initial only for production workloads. Auto mode is reserved for non-critical batch workloads or development environments where evictions are acceptable. The workflow for using VPA in production is: run in Off mode for two to four weeks across a full traffic cycle, collect recommendations, apply them to manifests via GitOps during a low-traffic window, and re-evaluate quarterly.
On request sizing: minAllowed in VPA is always anchored to load test p99 observed usage, not to VPA’s recommendation from off-peak periods. This prevents VPA from shrinking requests toward near-zero values observed at 3am and then evicting pods at 9am when the requests no longer fit.
On CA and warm capacity: Overprovisioning buffer pods (low-priority Deployment + negative PriorityClass) are standard practice at any org that has been burned by CA bootstrap lag during a traffic event. The sizing is calibrated from load tests: buffer = expected peak replica count minus baseline replica count, sized for the workload’s request footprint.
On stabilization: Scale-down stabilizationWindowSeconds of 300s (the default) is treated as a floor, not a ceiling. For services with expensive startup (JVM warmup, cache population), it is extended to 600–900s to prevent premature scale-in during multi-wave traffic patterns.
On observability: Alerting on ScalingLimited=True for more than two minutes, sustained Pending pods, and rising container_cpu_throttled_seconds_total before VPA recommendations are trusted. The debugging workflow is always: metrics first, then events, then pod resource comparison, then cross-loop interaction analysis.
Common Misconfigurations
HPA Anti-Patterns
- CPU target above 75%: Leaves insufficient headroom for the ~90–120s reaction time pipeline. The service is already degraded before new pods serve traffic.
- No scaleUp policies: Allows HPA to multiply replicas in a single cycle, potentially overwhelming downstream dependencies.
- Using memory as a scale-out trigger: Memory-based HPA often fails to scale back in because most applications do not release allocated memory after load drops — the process holds the heap. HPA will see sustained high memory utilization and resist scale-in indefinitely. Use memory as an HPA metric only if you have confirmed your application actively releases memory under reduced load.
- Not accounting for pod warm-up: A newly scheduled pod is not immediately useful. If your service has a slow startup (JVM warmup, cache population), include
minReadySecondsand configure readiness probes that reflect actual traffic-readiness.
VPA Anti-Patterns
- Auto mode on stateful workloads: Eviction of a database or queue pod mid-operation is a data risk. Use
OfforInitial. - No
minAllowed: Without a lower bound, VPA will shrink requests toward observed minimums, which may be near zero during off-peak hours. - Switching to Auto during peak traffic: Triggers an immediate wave of evictions. Always test mode changes in off-peak windows.
- Combining with CPU-based HPA: Creates the feedback loop described earlier. Use orthogonal metrics.
Observability: Metrics That Matter
Autoscaling is only debuggable if you are measuring the right signals. The closing principle of this post — that the goal is observability, not perfect configuration — requires knowing exactly which metrics to watch.
HPA signals:
kube_horizontalpodautoscaler_status_desired_replicasvskube_horizontalpodautoscaler_status_current_replicas— the gap between these is your scale lag in real timekube_horizontalpodautoscaler_status_condition— surfacesScalingLimited,AbleToScale, andScalingActiveconditions;ScalingLimitedmeans rate policies or min/max bounds are constraining HPA from reaching its desired count- The raw metric value vs the target threshold for each configured metric — monitor these independently to catch noisy metrics driving unexpected scale decisions
VPA signals:
VPA.status.recommendation.containerRecommendations[].targetvs actual pod requests — the gap is your rightsizing debt- Eviction events on VPA-managed pods (
kubectl get events --field-selector reason=Evicted) — unexpected eviction frequency signals too-aggressive bounds or PDB misconfiguration container_cpu_throttled_seconds_total— a high value means VPA’s CPU observation is artificially suppressed; recommendations cannot be trusted until throttling is resolvedkube_pod_container_status_last_terminated_reason=OOMKilled— indicates VPA memory recommendations are too low orminAllowedis not set correctly
Cross-loop signals:
kube_pod_status_phase=Pendingwithreason=Unschedulable— the trigger condition for CA; sustained Pending pods mean either CA is bootstrapping or no node shape can fit the requested resources- Node instance type distribution over time — VPA-driven request inflation silently changing your node pool shape will appear here before it appears in cost reports
🧪 Exercise 12: Interrogate HPA Status Conditions
Practice reading the HPA status conditions that appear in production debugging. These conditions surface the internal state of the control loop.
What to observe: Once HPA hits
maxReplicas, theScalingLimitedcondition becomesTruewith a message indicating the bound was hit. In production, alerting onScalingLimited=Truefor more than a few minutes signals that yourmaxReplicasis too low or your workload has genuinely outgrown its current sizing.
Final Cleanup
When you’re done with all exercises:
# Delete the kind cluster entirelykind delete cluster --name autoscaling-lab
Summary
HPA Signal Tradeoff: CPU vs. External Metrics
| Dimension | CPU | RPS / Queue Depth |
|---|---|---|
| Signal latency | High (lagging ~45s+) | Low (near-real-time) |
| Infra dependency | None | Metrics pipeline required |
| VPA coupling risk | High — distorts utilization ratio | None — orthogonal signal |
| Throttling blind spot | Yes | No |
| Stability | Higher | Lower (noisy metrics amplify) |
| Failure mode | Under-scaling | Over-scaling |
HPA vs. VPA at a Glance
| Dimension | HPA | VPA |
|---|---|---|
| Scaling axis | Horizontal (replica count) | Vertical (resource requests) |
| Reaction speed | Seconds to minutes | Minutes to hours |
| Pod disruption | None | Restart required (unless In-Place beta) |
| Control model | Delayed P-controller | Statistical percentile estimator |
| Safe to combine | — | Only on orthogonal metrics |
| Best for | Spiky, stateless workloads | Rightsizing; stateful workloads |
| PDB interaction | Respects during rolling update | Updater respects PDB — can stall silently |
Full Reference
| HPA | VPA | |
|---|---|---|
| Controller location | kube-controller-manager | Separate Deployment (3 components) |
| Metrics source | Metrics APIs (resource/custom/external) | metrics-server + historical samples |
Understanding HPA as a delayed, saturating proportional controller with a 90–120 second reaction pipeline, and VPA as a statistical offline optimizer that must restart pods to apply its recommendations and cannot observe throttled CPU accurately, reframes how you tune both systems. Neither loop operates in isolation — they share the same node pool, react to overlapping signals, and can amplify each other’s effects into the destabilizing positive feedback loops described above. Map symptoms to the failure taxonomy before reaching for knobs. Instrument the signals in the observability section, and you will know which loop to blame before the incident review is scheduled.
Autoscaling is not about making systems perfectly elastic — that’s impossible given the phase lag, signal noise, and discrete provisioning steps involved. It is about designing systems where the failure modes are predictable, observable, and bounded. The engineers who succeed with autoscaling aren’t the ones who tune it perfectly — they’re the ones who understand how it breaks.
Further reading: KEP-1287 In-Place Pod Vertical Scaling · HPA algorithm design doc · autoscaling/v2 API reference

Leave a comment